Pakistani vs Brazilian Associate's Degree
COMPARE
Pakistani
Brazilian
Associate's Degree
Associate's Degree Comparison
Pakistanis
Brazilians
48.1%
ASSOCIATE'S DEGREE
88.0/ 100
METRIC RATING
136th/ 347
METRIC RANK
48.7%
ASSOCIATE'S DEGREE
93.7/ 100
METRIC RATING
123rd/ 347
METRIC RANK
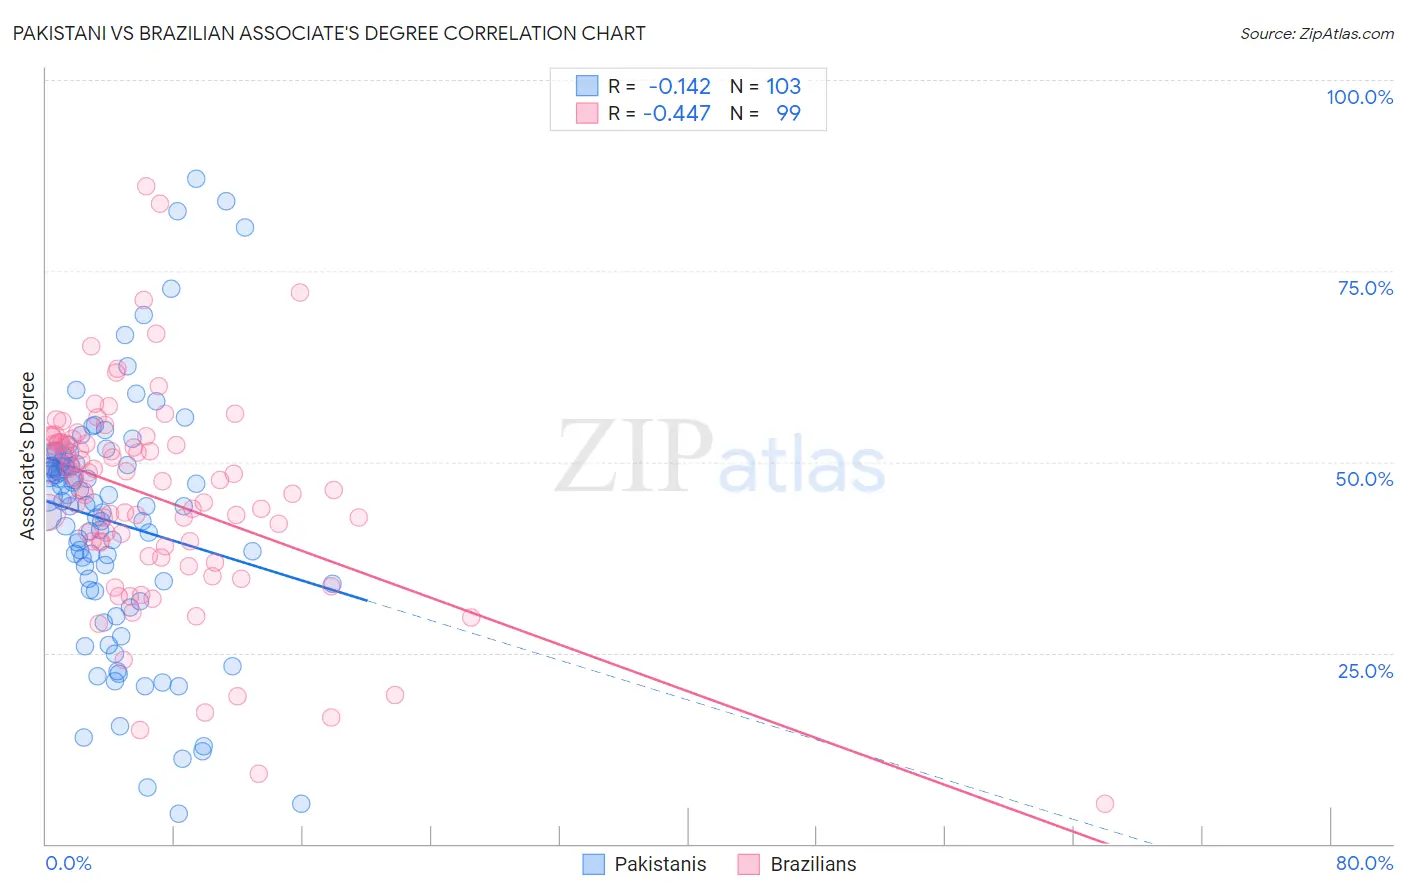
Pakistani vs Brazilian Associate's Degree Correlation Chart
The statistical analysis conducted on geographies consisting of 335,329,831 people shows a poor negative correlation between the proportion of Pakistanis and percentage of population with at least associate's degree education in the United States with a correlation coefficient (R) of -0.142 and weighted average of 48.1%. Similarly, the statistical analysis conducted on geographies consisting of 323,936,214 people shows a moderate negative correlation between the proportion of Brazilians and percentage of population with at least associate's degree education in the United States with a correlation coefficient (R) of -0.447 and weighted average of 48.7%, a difference of 1.3%.
Associate's Degree Correlation Summary
| Measurement | Pakistani | Brazilian |
| Minimum | 4.0% | 5.3% |
| Maximum | 87.1% | 86.0% |
| Range | 83.1% | 80.8% |
| Mean | 42.1% | 45.3% |
| Median | 44.2% | 47.5% |
| Interquartile 25% (IQ1) | 33.2% | 38.9% |
| Interquartile 75% (IQ3) | 49.8% | 52.5% |
| Interquartile Range (IQR) | 16.6% | 13.6% |
| Standard Deviation (Sample) | 16.2% | 13.6% |
| Standard Deviation (Population) | 16.1% | 13.6% |
Demographics Similar to Pakistanis and Brazilians by Associate's Degree
In terms of associate's degree, the demographic groups most similar to Pakistanis are Immigrants from Eritrea (48.1%, a difference of 0.040%), Polish (48.0%, a difference of 0.11%), European (48.2%, a difference of 0.18%), Moroccan (48.2%, a difference of 0.24%), and Assyrian/Chaldean/Syriac (48.2%, a difference of 0.26%). Similarly, the demographic groups most similar to Brazilians are Italian (48.7%, a difference of 0.060%), Ugandan (48.7%, a difference of 0.070%), Alsatian (48.8%, a difference of 0.29%), Serbian (48.5%, a difference of 0.30%), and Chinese (48.5%, a difference of 0.31%).
| Demographics | Rating | Rank | Associate's Degree |
| Lebanese | 94.6 /100 | #119 | Exceptional 48.8% |
| Alsatians | 94.6 /100 | #120 | Exceptional 48.8% |
| Ugandans | 93.9 /100 | #121 | Exceptional 48.7% |
| Italians | 93.9 /100 | #122 | Exceptional 48.7% |
| Brazilians | 93.7 /100 | #123 | Exceptional 48.7% |
| Serbians | 92.6 /100 | #124 | Exceptional 48.5% |
| Chinese | 92.5 /100 | #125 | Exceptional 48.5% |
| Immigrants | Syria | 92.2 /100 | #126 | Exceptional 48.5% |
| Immigrants | Uganda | 92.1 /100 | #127 | Exceptional 48.5% |
| Immigrants | Eastern Africa | 91.6 /100 | #128 | Exceptional 48.4% |
| Swedes | 91.5 /100 | #129 | Exceptional 48.4% |
| Immigrants | Jordan | 91.2 /100 | #130 | Exceptional 48.4% |
| Icelanders | 90.8 /100 | #131 | Exceptional 48.3% |
| Immigrants | Albania | 89.9 /100 | #132 | Excellent 48.2% |
| Assyrians/Chaldeans/Syriacs | 89.4 /100 | #133 | Excellent 48.2% |
| Moroccans | 89.3 /100 | #134 | Excellent 48.2% |
| Europeans | 89.0 /100 | #135 | Excellent 48.2% |
| Pakistanis | 88.0 /100 | #136 | Excellent 48.1% |
| Immigrants | Eritrea | 87.8 /100 | #137 | Excellent 48.1% |
| Poles | 87.3 /100 | #138 | Excellent 48.0% |
| Slovenes | 85.1 /100 | #139 | Excellent 47.9% |