Ottawa vs Blackfeet Nursery School
COMPARE
Ottawa
Blackfeet
Nursery School
Nursery School Comparison
Ottawa
Blackfeet
98.5%
NURSERY SCHOOL
99.8/ 100
METRIC RATING
48th/ 347
METRIC RANK
98.1%
NURSERY SCHOOL
87.5/ 100
METRIC RATING
139th/ 347
METRIC RANK
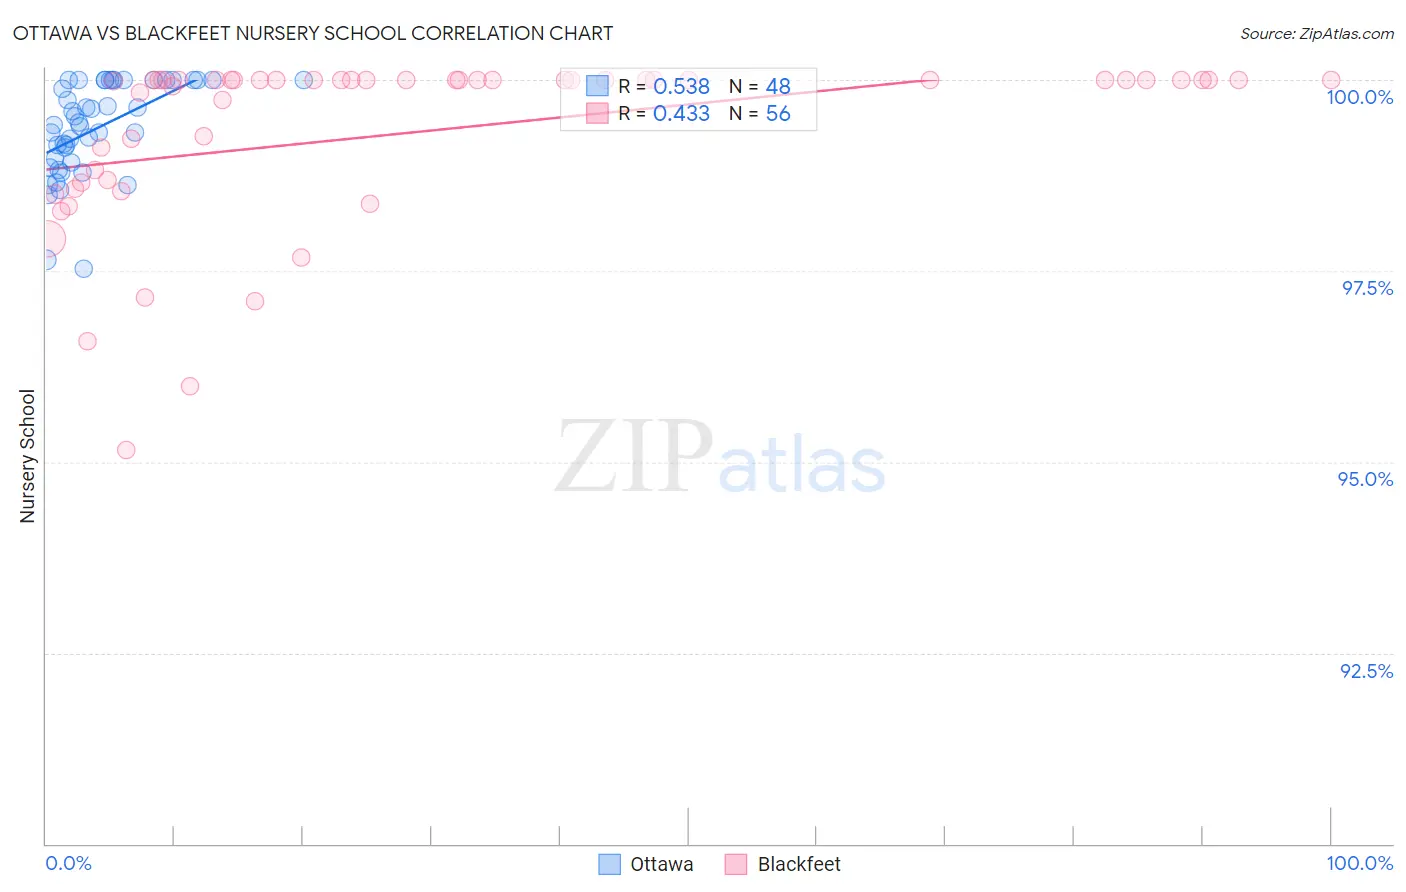
Ottawa vs Blackfeet Nursery School Correlation Chart
The statistical analysis conducted on geographies consisting of 49,956,726 people shows a substantial positive correlation between the proportion of Ottawa and percentage of population with at least nursery school education in the United States with a correlation coefficient (R) of 0.538 and weighted average of 98.5%. Similarly, the statistical analysis conducted on geographies consisting of 309,580,957 people shows a moderate positive correlation between the proportion of Blackfeet and percentage of population with at least nursery school education in the United States with a correlation coefficient (R) of 0.433 and weighted average of 98.1%, a difference of 0.34%.
Nursery School Correlation Summary
| Measurement | Ottawa | Blackfeet |
| Minimum | 97.5% | 95.2% |
| Maximum | 100.0% | 100.0% |
| Range | 2.5% | 4.8% |
| Mean | 99.4% | 99.3% |
| Median | 99.4% | 100.0% |
| Interquartile 25% (IQ1) | 98.9% | 98.7% |
| Interquartile 75% (IQ3) | 100.0% | 100.0% |
| Interquartile Range (IQR) | 1.1% | 1.3% |
| Standard Deviation (Sample) | 0.62% | 1.1% |
| Standard Deviation (Population) | 0.61% | 1.1% |
Similar Demographics by Nursery School
Demographics Similar to Ottawa by Nursery School
In terms of nursery school, the demographic groups most similar to Ottawa are White/Caucasian (98.5%, a difference of 0.0%), Celtic (98.5%, a difference of 0.0%), Czechoslovakian (98.5%, a difference of 0.010%), Estonian (98.5%, a difference of 0.010%), and Australian (98.5%, a difference of 0.010%).
| Demographics | Rating | Rank | Nursery School |
| Luxembourgers | 99.9 /100 | #41 | Exceptional 98.5% |
| Eastern Europeans | 99.9 /100 | #42 | Exceptional 98.5% |
| Native Hawaiians | 99.9 /100 | #43 | Exceptional 98.5% |
| Belgians | 99.9 /100 | #44 | Exceptional 98.5% |
| Northern Europeans | 99.9 /100 | #45 | Exceptional 98.5% |
| Hungarians | 99.9 /100 | #46 | Exceptional 98.5% |
| Czechoslovakians | 99.9 /100 | #47 | Exceptional 98.5% |
| Ottawa | 99.8 /100 | #48 | Exceptional 98.5% |
| Whites/Caucasians | 99.8 /100 | #49 | Exceptional 98.5% |
| Celtics | 99.8 /100 | #50 | Exceptional 98.5% |
| Estonians | 99.8 /100 | #51 | Exceptional 98.5% |
| Australians | 99.8 /100 | #52 | Exceptional 98.5% |
| Kiowa | 99.8 /100 | #53 | Exceptional 98.4% |
| Pueblo | 99.8 /100 | #54 | Exceptional 98.4% |
| Immigrants | Scotland | 99.8 /100 | #55 | Exceptional 98.4% |
Demographics Similar to Blackfeet by Nursery School
In terms of nursery school, the demographic groups most similar to Blackfeet are Israeli (98.1%, a difference of 0.0%), Immigrants from Romania (98.1%, a difference of 0.0%), Immigrants from Bulgaria (98.1%, a difference of 0.010%), Immigrants from Hungary (98.1%, a difference of 0.010%), and Immigrants from Kuwait (98.1%, a difference of 0.010%).
| Demographics | Rating | Rank | Nursery School |
| Seminole | 90.9 /100 | #132 | Exceptional 98.2% |
| Immigrants | Europe | 90.7 /100 | #133 | Exceptional 98.1% |
| Immigrants | Bulgaria | 89.4 /100 | #134 | Excellent 98.1% |
| Immigrants | Hungary | 89.3 /100 | #135 | Excellent 98.1% |
| Immigrants | Kuwait | 88.9 /100 | #136 | Excellent 98.1% |
| Israelis | 88.2 /100 | #137 | Excellent 98.1% |
| Immigrants | Romania | 88.0 /100 | #138 | Excellent 98.1% |
| Blackfeet | 87.5 /100 | #139 | Excellent 98.1% |
| Palestinians | 83.7 /100 | #140 | Excellent 98.1% |
| Immigrants | Turkey | 83.0 /100 | #141 | Excellent 98.1% |
| Burmese | 81.7 /100 | #142 | Excellent 98.1% |
| Marshallese | 81.2 /100 | #143 | Excellent 98.1% |
| Alsatians | 80.3 /100 | #144 | Excellent 98.1% |
| Immigrants | Israel | 78.5 /100 | #145 | Good 98.1% |
| Filipinos | 78.5 /100 | #146 | Good 98.1% |