Osage vs Iroquois Kindergarten

COMPARE

Osage
Race
Ancestry
AfghanAfricanAlaska NativeAlaskan AthabascanAlbanianAleutAlsatianAmericanApacheArabArapahoArgentineanArmenianAssyrian/Chaldean/SyriacAustralianAustrianBahamianBangladeshiBarbadianBasqueBelgianBelizeanBermudanBhutaneseBlackfeetBolivianBrazilianBritishBritish West IndianBulgarianBurmeseCajunCambodianCanadianCape VerdeanCarpatho RusynCelticCentral AmericanCentral American IndianCherokeeCheyenneChickasawChileanChineseChippewaChoctawColombianColvilleComancheCosta RicanCreeCreekCroatianCrowCubanCypriotCzechCzechoslovakianDanishDelawareDominicanDutchDutch West IndianEastern EuropeanEcuadorianEgyptianEnglishEstonianEthiopianEuropeanFijianFilipinoFinnishFrenchFrench American IndianFrench CanadianGermanGerman RussianGhanaianGreekGuamanian/ChamorroGuatemalanGuyaneseHaitianHmongHonduranHopiHoumaHungarianIcelanderIndian (Asian)IndonesianInupiatIranianIraqiIrishIsraeliItalianJamaicanJapaneseJordanianKenyanKiowaKoreanLaotianLatvianLebaneseLiberianLithuanianLumbeeLuxembourgerMacedonianMalaysianMalteseMarshalleseMenomineeMexicanMexican American IndianMongolianMoroccanNative HawaiianNavajoNepaleseNew ZealanderNicaraguanNigerianNorthern EuropeanNorwegianOkinawanOsageOttawaPaiutePakistaniPalestinianPanamanianParaguayanPennsylvania GermanPeruvianPimaPolishPortuguesePotawatomiPuebloPuerto RicanPuget Sound SalishRomanianRussianSalvadoranSamoanScandinavianScotch-IrishScottishSeminoleSenegaleseSerbianShoshoneSierra LeoneanSiouxSlavicSlovakSloveneSomaliSouth AfricanSouth AmericanSouth American IndianSoviet UnionSpaniardSpanishSpanish AmericanSpanish American IndianSri LankanSubsaharan AfricanSudaneseSwedishSwissSyrianTaiwaneseThaiTlingit-HaidaTohono O'OdhamTonganTrinidadian and TobagonianTsimshianTurkishU.S. Virgin IslanderUgandanUkrainianUruguayanUteVenezuelanVietnameseWelshWest IndianYakamaYaquiYugoslavianYumanYup'ikZimbabwean
Immigration
NonimmigrantsImmigrantsAfghanistanAfricaAlbaniaArgentinaArmeniaAsiaAustraliaAustriaBahamasBangladeshBarbadosBelarusBelgiumBelizeBoliviaBosnia and HerzegovinaBrazilBulgariaBurma/MyanmarCabo VerdeCambodiaCameroonCanadaCaribbeanCentral AmericaChileChinaColombiaCongoCosta RicaCroatiaCubaCzechoslovakiaDenmarkDominicaDominican RepublicEastern AfricaEastern AsiaEastern EuropeEcuadorEgyptEl SalvadorEnglandEritreaEthiopiaEuropeFijiFranceGermanyGhanaGreeceGrenadaGuatemalaGuyanaHaitiHondurasHong KongHungaryIndiaIndonesiaIranIraqIrelandIsraelItalyJamaicaJapanJordanKazakhstanKenyaKoreaKuwaitLaosLatin AmericaLatviaLebanonLiberiaLithuaniaMalaysiaMexicoMicronesiaMiddle AfricaMoldovaMoroccoNepalNetherlandsNicaraguaNigeriaNorth AmericaNorth MacedoniaNorthern AfricaNorthern EuropeNorwayOceaniaPakistanPanamaPeruPhilippinesPolandPortugalRomaniaRussiaSaudi ArabiaScotlandSenegalSerbiaSierra LeoneSingaporeSomaliaSouth AfricaSouth AmericaSouth Central AsiaSouth Eastern AsiaSouthern EuropeSpainSri LankaSt. Vincent and the GrenadinesSudanSwedenSwitzerlandSyriaTaiwanThailandTrinidad and TobagoTurkeyUgandaUkraineUruguayUzbekistanVenezuelaVietnamWest IndiesWestern AfricaWestern AsiaWestern EuropeYemenZaireZimbabweAzores
Iroquois
Race
Ancestry
AfghanAfricanAlaska NativeAlaskan AthabascanAlbanianAleutAlsatianAmericanApacheArabArapahoArgentineanArmenianAssyrian/Chaldean/SyriacAustralianAustrianBahamianBangladeshiBarbadianBasqueBelgianBelizeanBermudanBhutaneseBlackfeetBolivianBrazilianBritishBritish West IndianBulgarianBurmeseCajunCambodianCanadianCape VerdeanCarpatho RusynCelticCentral AmericanCentral American IndianCherokeeCheyenneChickasawChileanChineseChippewaChoctawColombianColvilleComancheCosta RicanCreeCreekCroatianCrowCubanCypriotCzechCzechoslovakianDanishDelawareDominicanDutchDutch West IndianEastern EuropeanEcuadorianEgyptianEnglishEstonianEthiopianEuropeanFijianFilipinoFinnishFrenchFrench American IndianFrench CanadianGermanGerman RussianGhanaianGreekGuamanian/ChamorroGuatemalanGuyaneseHaitianHmongHonduranHopiHoumaHungarianIcelanderIndian (Asian)IndonesianInupiatIranianIraqiIrishIroquoisIsraeliItalianJamaicanJapaneseJordanianKenyanKiowaKoreanLaotianLatvianLebaneseLiberianLithuanianLumbeeLuxembourgerMacedonianMalaysianMalteseMarshalleseMenomineeMexicanMexican American IndianMongolianMoroccanNative HawaiianNavajoNepaleseNew ZealanderNicaraguanNigerianNorthern EuropeanNorwegianOkinawanOttawaPaiutePakistaniPalestinianPanamanianParaguayanPennsylvania GermanPeruvianPimaPolishPortuguesePotawatomiPuebloPuerto RicanPuget Sound SalishRomanianRussianSalvadoranSamoanScandinavianScotch-IrishScottishSeminoleSenegaleseSerbianShoshoneSierra LeoneanSiouxSlavicSlovakSloveneSomaliSouth AfricanSouth AmericanSouth American IndianSoviet UnionSpaniardSpanishSpanish AmericanSpanish American IndianSri LankanSubsaharan AfricanSudaneseSwedishSwissSyrianTaiwaneseThaiTlingit-HaidaTohono O'OdhamTonganTrinidadian and TobagonianTsimshianTurkishU.S. Virgin IslanderUgandanUkrainianUruguayanUteVenezuelanVietnameseWelshWest IndianYakamaYaquiYugoslavianYumanYup'ikZimbabwean
Immigration
NonimmigrantsImmigrantsAfghanistanAfricaAlbaniaArgentinaArmeniaAsiaAustraliaAustriaBahamasBangladeshBarbadosBelarusBelgiumBelizeBoliviaBosnia and HerzegovinaBrazilBulgariaBurma/MyanmarCabo VerdeCambodiaCameroonCanadaCaribbeanCentral AmericaChileChinaColombiaCongoCosta RicaCroatiaCubaCzechoslovakiaDenmarkDominicaDominican RepublicEastern AfricaEastern AsiaEastern EuropeEcuadorEgyptEl SalvadorEnglandEritreaEthiopiaEuropeFijiFranceGermanyGhanaGreeceGrenadaGuatemalaGuyanaHaitiHondurasHong KongHungaryIndiaIndonesiaIranIraqIrelandIsraelItalyJamaicaJapanJordanKazakhstanKenyaKoreaKuwaitLaosLatin AmericaLatviaLebanonLiberiaLithuaniaMalaysiaMexicoMicronesiaMiddle AfricaMoldovaMoroccoNepalNetherlandsNicaraguaNigeriaNorth AmericaNorth MacedoniaNorthern AfricaNorthern EuropeNorwayOceaniaPakistanPanamaPeruPhilippinesPolandPortugalRomaniaRussiaSaudi ArabiaScotlandSenegalSerbiaSierra LeoneSingaporeSomaliaSouth AfricaSouth AmericaSouth Central AsiaSouth Eastern AsiaSouthern EuropeSpainSri LankaSt. Vincent and the GrenadinesSudanSwedenSwitzerlandSyriaTaiwanThailandTrinidad and TobagoTurkeyUgandaUkraineUruguayUzbekistanVenezuelaVietnamWest IndiesWestern AfricaWestern AsiaWestern EuropeYemenZaireZimbabweAzores
Kindergarten
Income
Poverty
Unemployment
Labor Participation
Family Structure
Vehicle Availability
Education Level
Disability

Kindergarten Comparison

Osage

Iroquois

Exceptional
Exceptional
98.3%
KINDERGARTEN
99.1/ 100
METRIC RATING
83rd/ 347
METRIC RANK
98.2%
KINDERGARTEN
93.5/ 100
METRIC RATING
125th/ 347
METRIC RANK

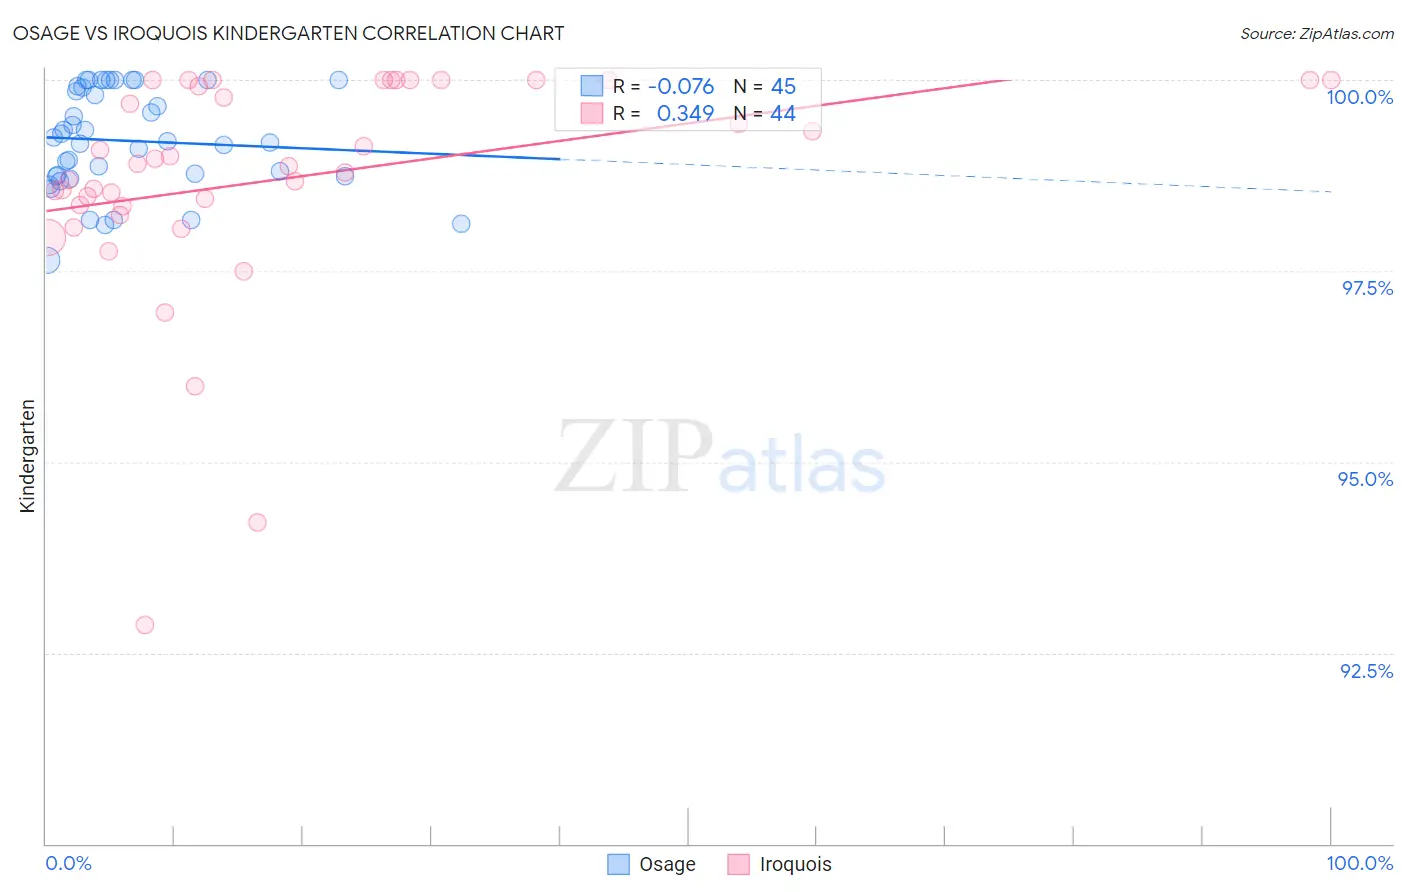
Osage vs Iroquois Kindergarten Correlation Chart

The statistical analysis conducted on geographies consisting of 91,808,929 people shows a slight negative correlation between the proportion of Osage and percentage of population with at least kindergarten education in the United States with a correlation coefficient (R) of -0.076 and weighted average of 98.3%. Similarly, the statistical analysis conducted on geographies consisting of 207,308,056 people shows a mild positive correlation between the proportion of Iroquois and percentage of population with at least kindergarten education in the United States with a correlation coefficient (R) of 0.349 and weighted average of 98.2%, a difference of 0.16%.
Osage vs Iroquois Kindergarten

Kindergarten Correlation Summary

MeasurementOsageIroquois
Minimum97.6%92.9%
Maximum100.0%100.0%
Range2.4%7.1%
Mean99.2%98.7%
Median99.2%98.9%
Interquartile 25% (IQ1)98.7%98.4%
Interquartile 75% (IQ3)99.9%100.0%
Interquartile Range (IQR)1.2%1.6%
Standard Deviation (Sample)0.66%1.5%
Standard Deviation (Population)0.65%1.5%

Similar Demographics by Kindergarten

Demographics Similar to Osage by Kindergarten

In terms of kindergarten, the demographic groups most similar to Osage are Icelander (98.3%, a difference of 0.0%), Potawatomi (98.3%, a difference of 0.0%), Immigrants from England (98.3%, a difference of 0.010%), Delaware (98.3%, a difference of 0.010%), and Shoshone (98.3%, a difference of 0.010%).
DemographicsRating | RankKindergarten
Immigrants | England
99.3
/100
|
#76
Exceptional
98.3%
Delaware
99.3
/100
|
#77
Exceptional
98.3%
Shoshone
99.2
/100
|
#78
Exceptional
98.3%
Immigrants | Belgium
99.2
/100
|
#79
Exceptional
98.3%
Immigrants | Lithuania
99.2
/100
|
#80
Exceptional
98.3%
Icelanders
99.2
/100
|
#81
Exceptional
98.3%
Potawatomi
99.2
/100
|
#82
Exceptional
98.3%
Osage
99.1
/100
|
#83
Exceptional
98.3%
Immigrants | Denmark
99.1
/100
|
#84
Exceptional
98.3%
Immigrants | Sweden
99.1
/100
|
#85
Exceptional
98.3%
Hopi
99.0
/100
|
#86
Exceptional
98.3%
Immigrants | Australia
99.0
/100
|
#87
Exceptional
98.3%
Ukrainians
98.8
/100
|
#88
Exceptional
98.3%
Immigrants | South Africa
98.8
/100
|
#89
Exceptional
98.3%
Zimbabweans
98.8
/100
|
#90
Exceptional
98.3%

Demographics Similar to Iroquois by Kindergarten

In terms of kindergarten, the demographic groups most similar to Iroquois are Menominee (98.2%, a difference of 0.0%), Syrian (98.2%, a difference of 0.0%), Lebanese (98.2%, a difference of 0.0%), Immigrants from Saudi Arabia (98.1%, a difference of 0.0%), and Okinawan (98.2%, a difference of 0.010%).
DemographicsRating | RankKindergarten
Yugoslavians
95.5
/100
|
#118
Exceptional
98.2%
Thais
94.8
/100
|
#119
Exceptional
98.2%
Okinawans
94.4
/100
|
#120
Exceptional
98.2%
Immigrants | Zimbabwe
94.0
/100
|
#121
Exceptional
98.2%
Immigrants | Japan
94.0
/100
|
#122
Exceptional
98.2%
Menominee
93.9
/100
|
#123
Exceptional
98.2%
Syrians
93.6
/100
|
#124
Exceptional
98.2%
Iroquois
93.5
/100
|
#125
Exceptional
98.2%
Lebanese
93.5
/100
|
#126
Exceptional
98.2%
Immigrants | Saudi Arabia
93.1
/100
|
#127
Exceptional
98.1%
Immigrants | Serbia
92.4
/100
|
#128
Exceptional
98.1%
Seminole
91.5
/100
|
#129
Exceptional
98.1%
Immigrants | Croatia
91.2
/100
|
#130
Exceptional
98.1%
Cambodians
91.2
/100
|
#131
Exceptional
98.1%
Spaniards
91.0
/100
|
#132
Exceptional
98.1%