Okinawan vs Paiute Doctorate Degree
COMPARE
Okinawan
Paiute
Doctorate Degree
Doctorate Degree Comparison
Okinawans
Paiute
3.3%
DOCTORATE DEGREE
100.0/ 100
METRIC RATING
3rd/ 347
METRIC RANK
1.5%
DOCTORATE DEGREE
0.4/ 100
METRIC RATING
276th/ 347
METRIC RANK
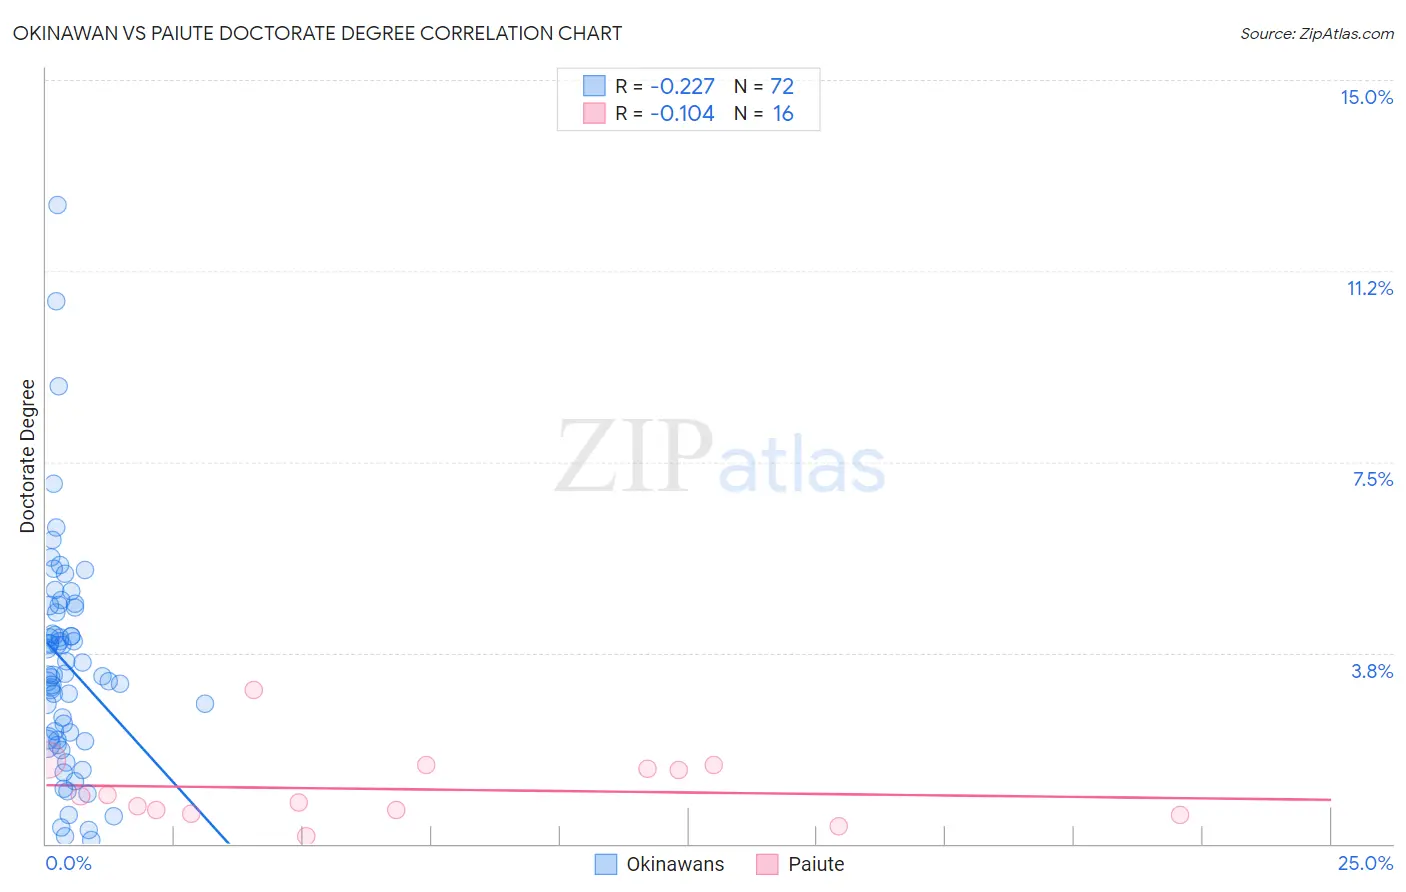
Okinawan vs Paiute Doctorate Degree Correlation Chart
The statistical analysis conducted on geographies consisting of 73,671,875 people shows a weak negative correlation between the proportion of Okinawans and percentage of population with at least doctorate degree education in the United States with a correlation coefficient (R) of -0.227 and weighted average of 3.3%. Similarly, the statistical analysis conducted on geographies consisting of 58,124,272 people shows a poor negative correlation between the proportion of Paiute and percentage of population with at least doctorate degree education in the United States with a correlation coefficient (R) of -0.104 and weighted average of 1.5%, a difference of 123.2%.
Doctorate Degree Correlation Summary
| Measurement | Okinawan | Paiute |
| Minimum | 0.067% | 0.15% |
| Maximum | 12.6% | 3.0% |
| Range | 12.5% | 2.9% |
| Mean | 3.5% | 1.1% |
| Median | 3.3% | 0.88% |
| Interquartile 25% (IQ1) | 2.0% | 0.62% |
| Interquartile 75% (IQ3) | 4.6% | 1.5% |
| Interquartile Range (IQR) | 2.5% | 0.88% |
| Standard Deviation (Sample) | 2.2% | 0.70% |
| Standard Deviation (Population) | 2.2% | 0.67% |
Similar Demographics by Doctorate Degree
Demographics Similar to Okinawans by Doctorate Degree
In terms of doctorate degree, the demographic groups most similar to Okinawans are Immigrants from Taiwan (3.2%, a difference of 2.6%), Iranian (3.1%, a difference of 4.2%), Filipino (3.4%, a difference of 4.7%), Immigrants from Switzerland (3.1%, a difference of 6.2%), and Immigrants from China (3.1%, a difference of 6.3%).
| Demographics | Rating | Rank | Doctorate Degree |
| Immigrants | Singapore | 100.0 /100 | #1 | Exceptional 3.7% |
| Filipinos | 100.0 /100 | #2 | Exceptional 3.4% |
| Okinawans | 100.0 /100 | #3 | Exceptional 3.3% |
| Immigrants | Taiwan | 100.0 /100 | #4 | Exceptional 3.2% |
| Iranians | 100.0 /100 | #5 | Exceptional 3.1% |
| Immigrants | Switzerland | 100.0 /100 | #6 | Exceptional 3.1% |
| Immigrants | China | 100.0 /100 | #7 | Exceptional 3.1% |
| Immigrants | Israel | 100.0 /100 | #8 | Exceptional 3.0% |
| Immigrants | Iran | 100.0 /100 | #9 | Exceptional 3.0% |
| Immigrants | Eastern Asia | 100.0 /100 | #10 | Exceptional 3.0% |
| Indians (Asian) | 100.0 /100 | #11 | Exceptional 2.9% |
| Immigrants | Belgium | 100.0 /100 | #12 | Exceptional 2.9% |
| Immigrants | Sweden | 100.0 /100 | #13 | Exceptional 2.9% |
| Immigrants | France | 100.0 /100 | #14 | Exceptional 2.9% |
| Immigrants | India | 100.0 /100 | #15 | Exceptional 2.8% |
Demographics Similar to Paiute by Doctorate Degree
In terms of doctorate degree, the demographic groups most similar to Paiute are Aleut (1.5%, a difference of 0.050%), Yaqui (1.5%, a difference of 0.17%), Sioux (1.5%, a difference of 0.19%), Immigrants from Barbados (1.5%, a difference of 0.30%), and Immigrants from Trinidad and Tobago (1.5%, a difference of 0.39%).
| Demographics | Rating | Rank | Doctorate Degree |
| Crow | 0.5 /100 | #269 | Tragic 1.5% |
| Salvadorans | 0.5 /100 | #270 | Tragic 1.5% |
| Immigrants | Trinidad and Tobago | 0.5 /100 | #271 | Tragic 1.5% |
| Immigrants | Barbados | 0.4 /100 | #272 | Tragic 1.5% |
| Sioux | 0.4 /100 | #273 | Tragic 1.5% |
| Yaqui | 0.4 /100 | #274 | Tragic 1.5% |
| Aleuts | 0.4 /100 | #275 | Tragic 1.5% |
| Paiute | 0.4 /100 | #276 | Tragic 1.5% |
| Bahamians | 0.4 /100 | #277 | Tragic 1.5% |
| Hawaiians | 0.4 /100 | #278 | Tragic 1.5% |
| Marshallese | 0.4 /100 | #279 | Tragic 1.5% |
| Ecuadorians | 0.4 /100 | #280 | Tragic 1.5% |
| Tohono O'odham | 0.4 /100 | #281 | Tragic 1.5% |
| British West Indians | 0.3 /100 | #282 | Tragic 1.5% |
| Central Americans | 0.3 /100 | #283 | Tragic 1.5% |