Okinawan vs Immigrants from Canada 3rd Grade

COMPARE

Okinawan
Race
Ancestry
AfghanAfricanAlaska NativeAlaskan AthabascanAlbanianAleutAlsatianAmericanApacheArabArapahoArgentineanArmenianAssyrian/Chaldean/SyriacAustralianAustrianBahamianBangladeshiBarbadianBasqueBelgianBelizeanBermudanBhutaneseBlackfeetBolivianBrazilianBritishBritish West IndianBulgarianBurmeseCajunCambodianCanadianCape VerdeanCarpatho RusynCelticCentral AmericanCentral American IndianCherokeeCheyenneChickasawChileanChineseChippewaChoctawColombianColvilleComancheCosta RicanCreeCreekCroatianCrowCubanCypriotCzechCzechoslovakianDanishDelawareDominicanDutchDutch West IndianEastern EuropeanEcuadorianEgyptianEnglishEstonianEthiopianEuropeanFijianFilipinoFinnishFrenchFrench American IndianFrench CanadianGermanGerman RussianGhanaianGreekGuamanian/ChamorroGuatemalanGuyaneseHaitianHmongHonduranHopiHoumaHungarianIcelanderIndian (Asian)IndonesianInupiatIranianIraqiIrishIroquoisIsraeliItalianJamaicanJapaneseJordanianKenyanKiowaKoreanLaotianLatvianLebaneseLiberianLithuanianLumbeeLuxembourgerMacedonianMalaysianMalteseMarshalleseMenomineeMexicanMexican American IndianMongolianMoroccanNative HawaiianNavajoNepaleseNew ZealanderNicaraguanNigerianNorthern EuropeanNorwegianOkinawanOsageOttawaPaiutePakistaniPalestinianPanamanianParaguayanPennsylvania GermanPeruvianPimaPolishPortuguesePotawatomiPuebloPuerto RicanPuget Sound SalishRomanianRussianSalvadoranSamoanScandinavianScotch-IrishScottishSeminoleSenegaleseSerbianShoshoneSierra LeoneanSiouxSlavicSlovakSloveneSomaliSouth AfricanSouth AmericanSouth American IndianSoviet UnionSpaniardSpanishSpanish AmericanSpanish American IndianSri LankanSubsaharan AfricanSudaneseSwedishSwissSyrianTaiwaneseThaiTlingit-HaidaTohono O'OdhamTonganTrinidadian and TobagonianTsimshianTurkishU.S. Virgin IslanderUgandanUkrainianUruguayanUteVenezuelanVietnameseWelshWest IndianYakamaYaquiYugoslavianYumanYup'ikZimbabwean
Immigration
NonimmigrantsImmigrantsAfghanistanAfricaAlbaniaArgentinaArmeniaAsiaAustraliaAustriaBahamasBangladeshBarbadosBelarusBelgiumBelizeBoliviaBosnia and HerzegovinaBrazilBulgariaBurma/MyanmarCabo VerdeCambodiaCameroonCaribbeanCentral AmericaChileChinaColombiaCongoCosta RicaCroatiaCubaCzechoslovakiaDenmarkDominicaDominican RepublicEastern AfricaEastern AsiaEastern EuropeEcuadorEgyptEl SalvadorEnglandEritreaEthiopiaEuropeFijiFranceGermanyGhanaGreeceGrenadaGuatemalaGuyanaHaitiHondurasHong KongHungaryIndiaIndonesiaIranIraqIrelandIsraelItalyJamaicaJapanJordanKazakhstanKenyaKoreaKuwaitLaosLatin AmericaLatviaLebanonLiberiaLithuaniaMalaysiaMexicoMicronesiaMiddle AfricaMoldovaMoroccoNepalNetherlandsNicaraguaNigeriaNorth AmericaNorth MacedoniaNorthern AfricaNorthern EuropeNorwayOceaniaPakistanPanamaPeruPhilippinesPolandPortugalRomaniaRussiaSaudi ArabiaScotlandSenegalSerbiaSierra LeoneSingaporeSomaliaSouth AfricaSouth AmericaSouth Central AsiaSouth Eastern AsiaSouthern EuropeSpainSri LankaSt. Vincent and the GrenadinesSudanSwedenSwitzerlandSyriaTaiwanThailandTrinidad and TobagoTurkeyUgandaUkraineUruguayUzbekistanVenezuelaVietnamWest IndiesWestern AfricaWestern AsiaWestern EuropeYemenZaireZimbabweAzores
Immigrants from Canada
Race
Ancestry
AfghanAfricanAlaska NativeAlaskan AthabascanAlbanianAleutAlsatianAmericanApacheArabArapahoArgentineanArmenianAssyrian/Chaldean/SyriacAustralianAustrianBahamianBangladeshiBarbadianBasqueBelgianBelizeanBermudanBhutaneseBlackfeetBolivianBrazilianBritishBritish West IndianBulgarianBurmeseCajunCambodianCanadianCape VerdeanCarpatho RusynCelticCentral AmericanCentral American IndianCherokeeCheyenneChickasawChileanChineseChippewaChoctawColombianColvilleComancheCosta RicanCreeCreekCroatianCrowCubanCypriotCzechCzechoslovakianDanishDelawareDominicanDutchDutch West IndianEastern EuropeanEcuadorianEgyptianEnglishEstonianEthiopianEuropeanFijianFilipinoFinnishFrenchFrench American IndianFrench CanadianGermanGerman RussianGhanaianGreekGuamanian/ChamorroGuatemalanGuyaneseHaitianHmongHonduranHopiHoumaHungarianIcelanderIndian (Asian)IndonesianInupiatIranianIraqiIrishIroquoisIsraeliItalianJamaicanJapaneseJordanianKenyanKiowaKoreanLaotianLatvianLebaneseLiberianLithuanianLumbeeLuxembourgerMacedonianMalaysianMalteseMarshalleseMenomineeMexicanMexican American IndianMongolianMoroccanNative HawaiianNavajoNepaleseNew ZealanderNicaraguanNigerianNorthern EuropeanNorwegianOsageOttawaPaiutePakistaniPalestinianPanamanianParaguayanPennsylvania GermanPeruvianPimaPolishPortuguesePotawatomiPuebloPuerto RicanPuget Sound SalishRomanianRussianSalvadoranSamoanScandinavianScotch-IrishScottishSeminoleSenegaleseSerbianShoshoneSierra LeoneanSiouxSlavicSlovakSloveneSomaliSouth AfricanSouth AmericanSouth American IndianSoviet UnionSpaniardSpanishSpanish AmericanSpanish American IndianSri LankanSubsaharan AfricanSudaneseSwedishSwissSyrianTaiwaneseThaiTlingit-HaidaTohono O'OdhamTonganTrinidadian and TobagonianTsimshianTurkishU.S. Virgin IslanderUgandanUkrainianUruguayanUteVenezuelanVietnameseWelshWest IndianYakamaYaquiYugoslavianYumanYup'ikZimbabwean
Immigration
NonimmigrantsImmigrantsAfghanistanAfricaAlbaniaArgentinaArmeniaAsiaAustraliaAustriaBahamasBangladeshBarbadosBelarusBelgiumBelizeBoliviaBosnia and HerzegovinaBrazilBulgariaBurma/MyanmarCabo VerdeCambodiaCameroonCanadaCaribbeanCentral AmericaChileChinaColombiaCongoCosta RicaCroatiaCubaCzechoslovakiaDenmarkDominicaDominican RepublicEastern AfricaEastern AsiaEastern EuropeEcuadorEgyptEl SalvadorEnglandEritreaEthiopiaEuropeFijiFranceGermanyGhanaGreeceGrenadaGuatemalaGuyanaHaitiHondurasHong KongHungaryIndiaIndonesiaIranIraqIrelandIsraelItalyJamaicaJapanJordanKazakhstanKenyaKoreaKuwaitLaosLatin AmericaLatviaLebanonLiberiaLithuaniaMalaysiaMexicoMicronesiaMiddle AfricaMoldovaMoroccoNepalNetherlandsNicaraguaNigeriaNorth AmericaNorth MacedoniaNorthern AfricaNorthern EuropeNorwayOceaniaPakistanPanamaPeruPhilippinesPolandPortugalRomaniaRussiaSaudi ArabiaScotlandSenegalSerbiaSierra LeoneSingaporeSomaliaSouth AfricaSouth AmericaSouth Central AsiaSouth Eastern AsiaSouthern EuropeSpainSri LankaSt. Vincent and the GrenadinesSudanSwedenSwitzerlandSyriaTaiwanThailandTrinidad and TobagoTurkeyUgandaUkraineUruguayUzbekistanVenezuelaVietnamWest IndiesWestern AfricaWestern AsiaWestern EuropeYemenZaireZimbabweAzores
3rd Grade
Income
Poverty
Unemployment
Labor Participation
Family Structure
Vehicle Availability
Education Level
Disability

3rd Grade Comparison

Okinawans

Immigrants from Canada

Exceptional
Exceptional
98.0%
3RD GRADE
95.2/ 100
METRIC RATING
115th/ 347
METRIC RANK
98.2%
3RD GRADE
99.7/ 100
METRIC RATING
62nd/ 347
METRIC RANK

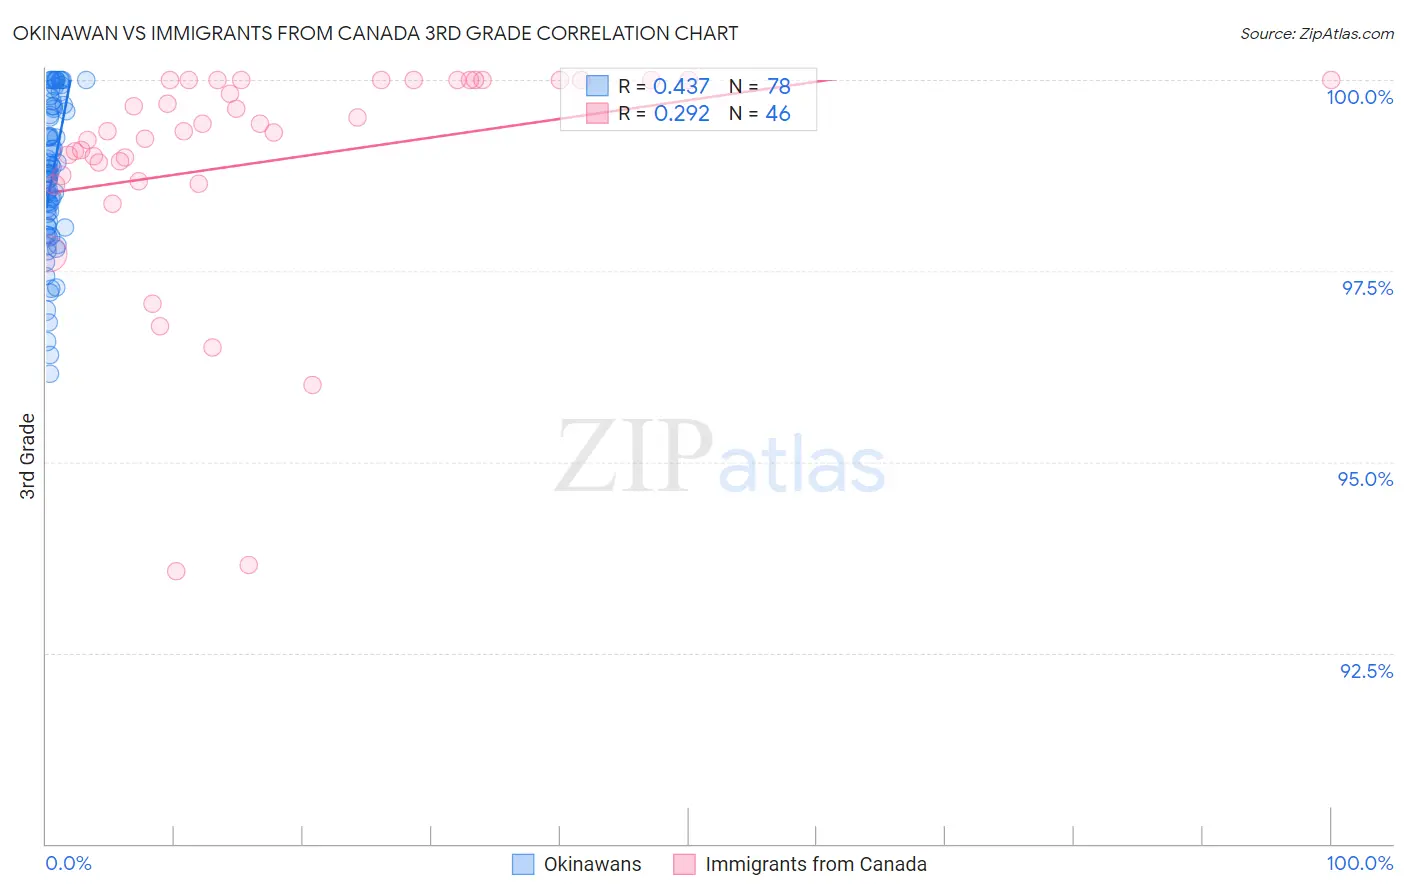
Okinawan vs Immigrants from Canada 3rd Grade Correlation Chart

The statistical analysis conducted on geographies consisting of 73,744,614 people shows a moderate positive correlation between the proportion of Okinawans and percentage of population with at least 3rd grade education in the United States with a correlation coefficient (R) of 0.437 and weighted average of 98.0%. Similarly, the statistical analysis conducted on geographies consisting of 459,397,554 people shows a weak positive correlation between the proportion of Immigrants from Canada and percentage of population with at least 3rd grade education in the United States with a correlation coefficient (R) of 0.292 and weighted average of 98.2%, a difference of 0.24%.
Okinawan vs Immigrants from Canada 3rd Grade

3rd Grade Correlation Summary

MeasurementOkinawanImmigrants from Canada
Minimum96.2%93.6%
Maximum100.0%100.0%
Range3.8%6.4%
Mean98.7%98.9%
Median98.8%99.3%
Interquartile 25% (IQ1)98.1%98.8%
Interquartile 75% (IQ3)99.6%100.0%
Interquartile Range (IQR)1.5%1.2%
Standard Deviation (Sample)0.97%1.5%
Standard Deviation (Population)0.97%1.5%

Similar Demographics by 3rd Grade

Demographics Similar to Okinawans by 3rd Grade

In terms of 3rd grade, the demographic groups most similar to Okinawans are Thai (98.0%, a difference of 0.0%), Menominee (98.0%, a difference of 0.0%), Immigrants from Norway (98.0%, a difference of 0.0%), Immigrants from France (98.0%, a difference of 0.0%), and Iranian (98.0%, a difference of 0.010%).
DemographicsRating | Rank3rd Grade
Immigrants | Singapore
96.7
/100
|
#108
Exceptional
98.0%
Pima
96.7
/100
|
#109
Exceptional
98.0%
Immigrants | Switzerland
96.6
/100
|
#110
Exceptional
98.0%
Basques
96.5
/100
|
#111
Exceptional
98.0%
Immigrants | Latvia
96.0
/100
|
#112
Exceptional
98.0%
Thais
95.5
/100
|
#113
Exceptional
98.0%
Menominee
95.4
/100
|
#114
Exceptional
98.0%
Okinawans
95.2
/100
|
#115
Exceptional
98.0%
Immigrants | Norway
95.2
/100
|
#116
Exceptional
98.0%
Immigrants | France
95.1
/100
|
#117
Exceptional
98.0%
Iranians
94.9
/100
|
#118
Exceptional
98.0%
Spanish
94.8
/100
|
#119
Exceptional
98.0%
Immigrants | Croatia
94.4
/100
|
#120
Exceptional
98.0%
Iroquois
94.1
/100
|
#121
Exceptional
98.0%
Lebanese
94.1
/100
|
#122
Exceptional
98.0%

Demographics Similar to Immigrants from Canada by 3rd Grade

In terms of 3rd grade, the demographic groups most similar to Immigrants from Canada are Pueblo (98.2%, a difference of 0.0%), Austrian (98.3%, a difference of 0.010%), Slavic (98.3%, a difference of 0.010%), Greek (98.3%, a difference of 0.010%), and Maltese (98.3%, a difference of 0.010%).
DemographicsRating | Rank3rd Grade
Americans
99.8
/100
|
#55
Exceptional
98.3%
Austrians
99.8
/100
|
#56
Exceptional
98.3%
Slavs
99.7
/100
|
#57
Exceptional
98.3%
Greeks
99.7
/100
|
#58
Exceptional
98.3%
Maltese
99.7
/100
|
#59
Exceptional
98.3%
Creek
99.7
/100
|
#60
Exceptional
98.2%
Pueblo
99.7
/100
|
#61
Exceptional
98.2%
Immigrants | Canada
99.7
/100
|
#62
Exceptional
98.2%
Immigrants | North America
99.7
/100
|
#63
Exceptional
98.2%
Kiowa
99.6
/100
|
#64
Exceptional
98.2%
New Zealanders
99.6
/100
|
#65
Exceptional
98.2%
Serbians
99.6
/100
|
#66
Exceptional
98.2%
Russians
99.6
/100
|
#67
Exceptional
98.2%
Immigrants | Northern Europe
99.6
/100
|
#68
Exceptional
98.2%
Canadians
99.6
/100
|
#69
Exceptional
98.2%