Okinawan vs Immigrants 6th Grade

COMPARE

Okinawan
Race
Ancestry
AfghanAfricanAlaska NativeAlaskan AthabascanAlbanianAleutAlsatianAmericanApacheArabArapahoArgentineanArmenianAssyrian/Chaldean/SyriacAustralianAustrianBahamianBangladeshiBarbadianBasqueBelgianBelizeanBermudanBhutaneseBlackfeetBolivianBrazilianBritishBritish West IndianBulgarianBurmeseCajunCambodianCanadianCape VerdeanCarpatho RusynCelticCentral AmericanCentral American IndianCherokeeCheyenneChickasawChileanChineseChippewaChoctawColombianColvilleComancheCosta RicanCreeCreekCroatianCrowCubanCypriotCzechCzechoslovakianDanishDelawareDominicanDutchDutch West IndianEastern EuropeanEcuadorianEgyptianEnglishEstonianEthiopianEuropeanFijianFilipinoFinnishFrenchFrench American IndianFrench CanadianGermanGerman RussianGhanaianGreekGuamanian/ChamorroGuatemalanGuyaneseHaitianHmongHonduranHopiHoumaHungarianIcelanderIndian (Asian)IndonesianInupiatIranianIraqiIrishIroquoisIsraeliItalianJamaicanJapaneseJordanianKenyanKiowaKoreanLaotianLatvianLebaneseLiberianLithuanianLumbeeLuxembourgerMacedonianMalaysianMalteseMarshalleseMenomineeMexicanMexican American IndianMongolianMoroccanNative HawaiianNavajoNepaleseNew ZealanderNicaraguanNigerianNorthern EuropeanNorwegianOkinawanOsageOttawaPaiutePakistaniPalestinianPanamanianParaguayanPennsylvania GermanPeruvianPimaPolishPortuguesePotawatomiPuebloPuerto RicanPuget Sound SalishRomanianRussianSalvadoranSamoanScandinavianScotch-IrishScottishSeminoleSenegaleseSerbianShoshoneSierra LeoneanSiouxSlavicSlovakSloveneSomaliSouth AfricanSouth AmericanSouth American IndianSoviet UnionSpaniardSpanishSpanish AmericanSpanish American IndianSri LankanSubsaharan AfricanSudaneseSwedishSwissSyrianTaiwaneseThaiTlingit-HaidaTohono O'OdhamTonganTrinidadian and TobagonianTsimshianTurkishU.S. Virgin IslanderUgandanUkrainianUruguayanUteVenezuelanVietnameseWelshWest IndianYakamaYaquiYugoslavianYumanYup'ikZimbabwean
Immigration
NonimmigrantsAfghanistanAfricaAlbaniaArgentinaArmeniaAsiaAustraliaAustriaBahamasBangladeshBarbadosBelarusBelgiumBelizeBoliviaBosnia and HerzegovinaBrazilBulgariaBurma/MyanmarCabo VerdeCambodiaCameroonCanadaCaribbeanCentral AmericaChileChinaColombiaCongoCosta RicaCroatiaCubaCzechoslovakiaDenmarkDominicaDominican RepublicEastern AfricaEastern AsiaEastern EuropeEcuadorEgyptEl SalvadorEnglandEritreaEthiopiaEuropeFijiFranceGermanyGhanaGreeceGrenadaGuatemalaGuyanaHaitiHondurasHong KongHungaryIndiaIndonesiaIranIraqIrelandIsraelItalyJamaicaJapanJordanKazakhstanKenyaKoreaKuwaitLaosLatin AmericaLatviaLebanonLiberiaLithuaniaMalaysiaMexicoMicronesiaMiddle AfricaMoldovaMoroccoNepalNetherlandsNicaraguaNigeriaNorth AmericaNorth MacedoniaNorthern AfricaNorthern EuropeNorwayOceaniaPakistanPanamaPeruPhilippinesPolandPortugalRomaniaRussiaSaudi ArabiaScotlandSenegalSerbiaSierra LeoneSingaporeSomaliaSouth AfricaSouth AmericaSouth Central AsiaSouth Eastern AsiaSouthern EuropeSpainSri LankaSt. Vincent and the GrenadinesSudanSwedenSwitzerlandSyriaTaiwanThailandTrinidad and TobagoTurkeyUgandaUkraineUruguayUzbekistanVenezuelaVietnamWest IndiesWestern AfricaWestern AsiaWestern EuropeYemenZaireZimbabweAzores
Immigrants
Race
Ancestry
AfghanAfricanAlaska NativeAlaskan AthabascanAlbanianAleutAlsatianAmericanApacheArabArapahoArgentineanArmenianAssyrian/Chaldean/SyriacAustralianAustrianBahamianBangladeshiBarbadianBasqueBelgianBelizeanBermudanBhutaneseBlackfeetBolivianBrazilianBritishBritish West IndianBulgarianBurmeseCajunCambodianCanadianCape VerdeanCarpatho RusynCelticCentral AmericanCentral American IndianCherokeeCheyenneChickasawChileanChineseChippewaChoctawColombianColvilleComancheCosta RicanCreeCreekCroatianCrowCubanCypriotCzechCzechoslovakianDanishDelawareDominicanDutchDutch West IndianEastern EuropeanEcuadorianEgyptianEnglishEstonianEthiopianEuropeanFijianFilipinoFinnishFrenchFrench American IndianFrench CanadianGermanGerman RussianGhanaianGreekGuamanian/ChamorroGuatemalanGuyaneseHaitianHmongHonduranHopiHoumaHungarianIcelanderIndian (Asian)IndonesianInupiatIranianIraqiIrishIroquoisIsraeliItalianJamaicanJapaneseJordanianKenyanKiowaKoreanLaotianLatvianLebaneseLiberianLithuanianLumbeeLuxembourgerMacedonianMalaysianMalteseMarshalleseMenomineeMexicanMexican American IndianMongolianMoroccanNative HawaiianNavajoNepaleseNew ZealanderNicaraguanNigerianNorthern EuropeanNorwegianOsageOttawaPaiutePakistaniPalestinianPanamanianParaguayanPennsylvania GermanPeruvianPimaPolishPortuguesePotawatomiPuebloPuerto RicanPuget Sound SalishRomanianRussianSalvadoranSamoanScandinavianScotch-IrishScottishSeminoleSenegaleseSerbianShoshoneSierra LeoneanSiouxSlavicSlovakSloveneSomaliSouth AfricanSouth AmericanSouth American IndianSoviet UnionSpaniardSpanishSpanish AmericanSpanish American IndianSri LankanSubsaharan AfricanSudaneseSwedishSwissSyrianTaiwaneseThaiTlingit-HaidaTohono O'OdhamTonganTrinidadian and TobagonianTsimshianTurkishU.S. Virgin IslanderUgandanUkrainianUruguayanUteVenezuelanVietnameseWelshWest IndianYakamaYaquiYugoslavianYumanYup'ikZimbabwean
Immigration
NonimmigrantsImmigrantsAfghanistanAfricaAlbaniaArgentinaArmeniaAsiaAustraliaAustriaBahamasBangladeshBarbadosBelarusBelgiumBelizeBoliviaBosnia and HerzegovinaBrazilBulgariaBurma/MyanmarCabo VerdeCambodiaCameroonCanadaCaribbeanCentral AmericaChileChinaColombiaCongoCosta RicaCroatiaCubaCzechoslovakiaDenmarkDominicaDominican RepublicEastern AfricaEastern AsiaEastern EuropeEcuadorEgyptEl SalvadorEnglandEritreaEthiopiaEuropeFijiFranceGermanyGhanaGreeceGrenadaGuatemalaGuyanaHaitiHondurasHong KongHungaryIndiaIndonesiaIranIraqIrelandIsraelItalyJamaicaJapanJordanKazakhstanKenyaKoreaKuwaitLaosLatin AmericaLatviaLebanonLiberiaLithuaniaMalaysiaMexicoMicronesiaMiddle AfricaMoldovaMoroccoNepalNetherlandsNicaraguaNigeriaNorth AmericaNorth MacedoniaNorthern AfricaNorthern EuropeNorwayOceaniaPakistanPanamaPeruPhilippinesPolandPortugalRomaniaRussiaSaudi ArabiaScotlandSenegalSerbiaSierra LeoneSingaporeSomaliaSouth AfricaSouth AmericaSouth Central AsiaSouth Eastern AsiaSouthern EuropeSpainSri LankaSt. Vincent and the GrenadinesSudanSwedenSwitzerlandSyriaTaiwanThailandTrinidad and TobagoTurkeyUgandaUkraineUruguayUzbekistanVenezuelaVietnamWest IndiesWestern AfricaWestern AsiaWestern EuropeYemenZaireZimbabweAzores
6th Grade
Income
Poverty
Unemployment
Labor Participation
Family Structure
Vehicle Availability
Education Level
Disability

6th Grade Comparison

Okinawans

Immigrants

Exceptional
Tragic
97.4%
6TH GRADE
94.2/ 100
METRIC RATING
124th/ 347
METRIC RANK
95.7%
6TH GRADE
0.0/ 100
METRIC RATING
301st/ 347
METRIC RANK

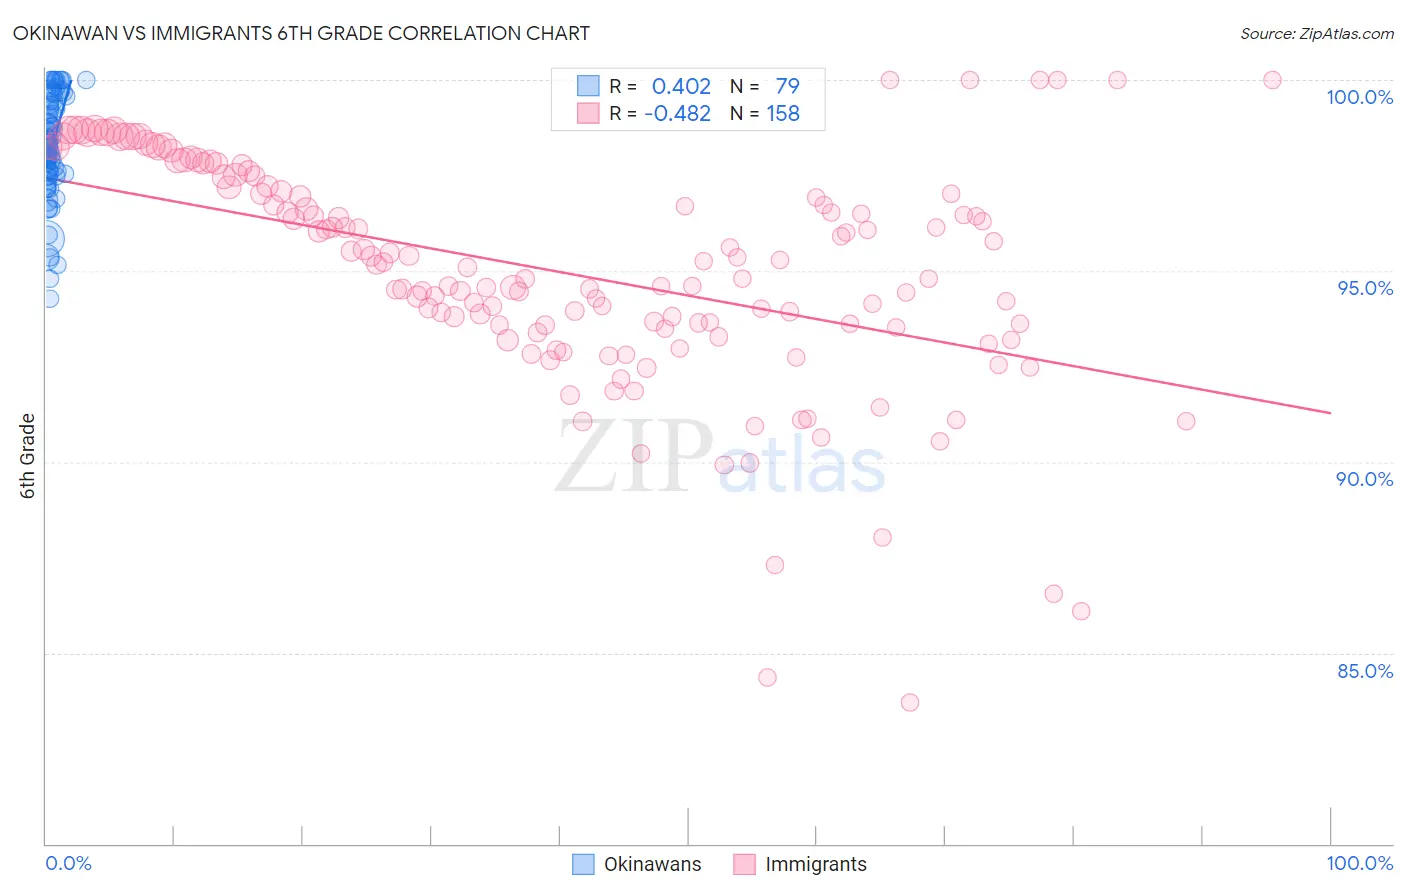
Okinawan vs Immigrants 6th Grade Correlation Chart

The statistical analysis conducted on geographies consisting of 73,779,368 people shows a moderate positive correlation between the proportion of Okinawans and percentage of population with at least 6th grade education in the United States with a correlation coefficient (R) of 0.402 and weighted average of 97.4%. Similarly, the statistical analysis conducted on geographies consisting of 577,786,840 people shows a moderate negative correlation between the proportion of Immigrants and percentage of population with at least 6th grade education in the United States with a correlation coefficient (R) of -0.482 and weighted average of 95.7%, a difference of 1.7%.
Okinawan vs Immigrants 6th Grade

6th Grade Correlation Summary

MeasurementOkinawanImmigrants
Minimum94.3%83.7%
Maximum100.0%100.0%
Range5.7%16.3%
Mean98.3%95.0%
Median98.3%95.1%
Interquartile 25% (IQ1)97.5%93.5%
Interquartile 75% (IQ3)99.4%97.2%
Interquartile Range (IQR)2.0%3.7%
Standard Deviation (Sample)1.4%3.0%
Standard Deviation (Population)1.4%3.0%

Similar Demographics by 6th Grade

Demographics Similar to Okinawans by 6th Grade

In terms of 6th grade, the demographic groups most similar to Okinawans are Hmong (97.4%, a difference of 0.0%), Syrian (97.4%, a difference of 0.010%), Immigrants from Norway (97.4%, a difference of 0.010%), Immigrants from France (97.4%, a difference of 0.010%), and Spanish (97.3%, a difference of 0.010%).
DemographicsRating | Rank6th Grade
Basques
95.4
/100
|
#117
Exceptional
97.4%
Immigrants | Japan
95.2
/100
|
#118
Exceptional
97.4%
Immigrants | Zimbabwe
95.0
/100
|
#119
Exceptional
97.4%
Syrians
94.8
/100
|
#120
Exceptional
97.4%
Immigrants | Norway
94.7
/100
|
#121
Exceptional
97.4%
Immigrants | France
94.5
/100
|
#122
Exceptional
97.4%
Hmong
94.4
/100
|
#123
Exceptional
97.4%
Okinawans
94.2
/100
|
#124
Exceptional
97.4%
Spanish
93.7
/100
|
#125
Exceptional
97.3%
Immigrants | Bulgaria
93.6
/100
|
#126
Exceptional
97.3%
Immigrants | Croatia
93.1
/100
|
#127
Exceptional
97.3%
Immigrants | Romania
92.0
/100
|
#128
Exceptional
97.3%
Immigrants | Serbia
91.9
/100
|
#129
Exceptional
97.3%
Cambodians
91.8
/100
|
#130
Exceptional
97.3%
Immigrants | Europe
91.1
/100
|
#131
Exceptional
97.3%

Demographics Similar to Immigrants by 6th Grade

In terms of 6th grade, the demographic groups most similar to Immigrants are Immigrants from Dominica (95.7%, a difference of 0.010%), Immigrants from Laos (95.7%, a difference of 0.020%), Immigrants from Burma/Myanmar (95.7%, a difference of 0.020%), Sri Lankan (95.8%, a difference of 0.030%), and Bangladeshi (95.7%, a difference of 0.080%).
DemographicsRating | Rank6th Grade
British West Indians
0.0
/100
|
#294
Tragic
96.0%
Immigrants | Grenada
0.0
/100
|
#295
Tragic
95.9%
Immigrants | South Eastern Asia
0.0
/100
|
#296
Tragic
95.9%
Haitians
0.0
/100
|
#297
Tragic
95.8%
Sri Lankans
0.0
/100
|
#298
Tragic
95.8%
Immigrants | Laos
0.0
/100
|
#299
Tragic
95.7%
Immigrants | Dominica
0.0
/100
|
#300
Tragic
95.7%
Immigrants | Immigrants
0.0
/100
|
#301
Tragic
95.7%
Immigrants | Burma/Myanmar
0.0
/100
|
#302
Tragic
95.7%
Bangladeshis
0.0
/100
|
#303
Tragic
95.7%
Indonesians
0.0
/100
|
#304
Tragic
95.6%
Immigrants | Cuba
0.0
/100
|
#305
Tragic
95.6%
Immigrants | Haiti
0.0
/100
|
#306
Tragic
95.6%
Guyanese
0.0
/100
|
#307
Tragic
95.6%
Immigrants | Caribbean
0.0
/100
|
#308
Tragic
95.6%