Northern European vs Armenian High School Diploma
COMPARE
Northern European
Armenian
High School Diploma
High School Diploma Comparison
Northern Europeans
Armenians
91.3%
HIGH SCHOOL DIPLOMA
99.8/ 100
METRIC RATING
42nd/ 347
METRIC RANK
88.6%
HIGH SCHOOL DIPLOMA
17.2/ 100
METRIC RATING
204th/ 347
METRIC RANK
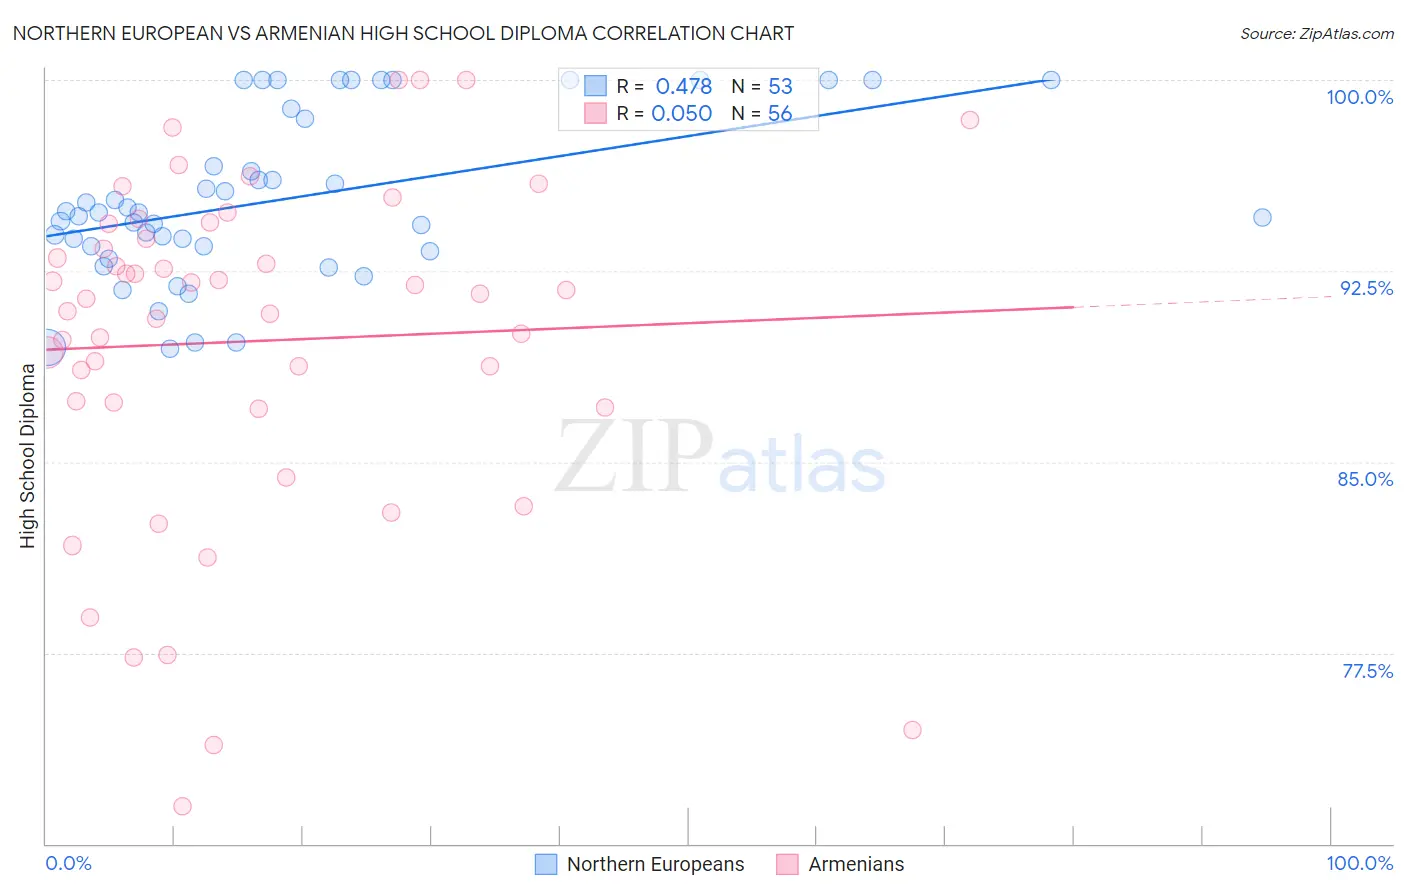
Northern European vs Armenian High School Diploma Correlation Chart
The statistical analysis conducted on geographies consisting of 406,096,351 people shows a moderate positive correlation between the proportion of Northern Europeans and percentage of population with at least high school diploma education in the United States with a correlation coefficient (R) of 0.478 and weighted average of 91.3%. Similarly, the statistical analysis conducted on geographies consisting of 310,954,685 people shows no correlation between the proportion of Armenians and percentage of population with at least high school diploma education in the United States with a correlation coefficient (R) of 0.050 and weighted average of 88.6%, a difference of 3.0%.
High School Diploma Correlation Summary
| Measurement | Northern European | Armenian |
| Minimum | 89.4% | 71.5% |
| Maximum | 100.0% | 100.0% |
| Range | 10.6% | 28.5% |
| Mean | 95.3% | 89.7% |
| Median | 94.8% | 91.5% |
| Interquartile 25% (IQ1) | 93.4% | 87.2% |
| Interquartile 75% (IQ3) | 98.7% | 94.0% |
| Interquartile Range (IQR) | 5.3% | 6.8% |
| Standard Deviation (Sample) | 3.2% | 6.7% |
| Standard Deviation (Population) | 3.2% | 6.6% |
Similar Demographics by High School Diploma
Demographics Similar to Northern Europeans by High School Diploma
In terms of high school diploma, the demographic groups most similar to Northern Europeans are Immigrants from Australia (91.3%, a difference of 0.010%), British (91.3%, a difference of 0.010%), Immigrants from Austria (91.3%, a difference of 0.020%), Turkish (91.2%, a difference of 0.020%), and Immigrants from Lithuania (91.3%, a difference of 0.030%).
| Demographics | Rating | Rank | High School Diploma |
| Irish | 99.9 /100 | #35 | Exceptional 91.4% |
| Tsimshian | 99.9 /100 | #36 | Exceptional 91.3% |
| Immigrants | Ireland | 99.9 /100 | #37 | Exceptional 91.3% |
| Immigrants | Scotland | 99.8 /100 | #38 | Exceptional 91.3% |
| Dutch | 99.8 /100 | #39 | Exceptional 91.3% |
| Immigrants | Lithuania | 99.8 /100 | #40 | Exceptional 91.3% |
| Immigrants | Australia | 99.8 /100 | #41 | Exceptional 91.3% |
| Northern Europeans | 99.8 /100 | #42 | Exceptional 91.3% |
| British | 99.8 /100 | #43 | Exceptional 91.3% |
| Immigrants | Austria | 99.8 /100 | #44 | Exceptional 91.3% |
| Turks | 99.8 /100 | #45 | Exceptional 91.2% |
| Greeks | 99.8 /100 | #46 | Exceptional 91.2% |
| Australians | 99.8 /100 | #47 | Exceptional 91.2% |
| Belgians | 99.8 /100 | #48 | Exceptional 91.2% |
| Bhutanese | 99.8 /100 | #49 | Exceptional 91.2% |
Demographics Similar to Armenians by High School Diploma
In terms of high school diploma, the demographic groups most similar to Armenians are Somali (88.6%, a difference of 0.010%), Korean (88.6%, a difference of 0.020%), Panamanian (88.6%, a difference of 0.020%), Immigrants from Micronesia (88.6%, a difference of 0.020%), and Hawaiian (88.6%, a difference of 0.030%).
| Demographics | Rating | Rank | High School Diploma |
| French American Indians | 21.5 /100 | #197 | Fair 88.7% |
| Liberians | 18.8 /100 | #198 | Poor 88.7% |
| Marshallese | 18.7 /100 | #199 | Poor 88.6% |
| Hawaiians | 18.3 /100 | #200 | Poor 88.6% |
| Koreans | 18.1 /100 | #201 | Poor 88.6% |
| Panamanians | 18.0 /100 | #202 | Poor 88.6% |
| Somalis | 17.5 /100 | #203 | Poor 88.6% |
| Armenians | 17.2 /100 | #204 | Poor 88.6% |
| Immigrants | Micronesia | 16.4 /100 | #205 | Poor 88.6% |
| Arapaho | 16.1 /100 | #206 | Poor 88.6% |
| Immigrants | Sierra Leone | 15.8 /100 | #207 | Poor 88.6% |
| Portuguese | 14.4 /100 | #208 | Poor 88.5% |
| Cherokee | 14.3 /100 | #209 | Poor 88.5% |
| Samoans | 14.0 /100 | #210 | Poor 88.5% |
| Inupiat | 13.1 /100 | #211 | Poor 88.5% |