Nonimmigrants vs Native Hawaiian 11th Grade

COMPARE

Nonimmigrants
Race
Ancestry
AfghanAfricanAlaska NativeAlaskan AthabascanAlbanianAleutAlsatianAmericanApacheArabArapahoArgentineanArmenianAssyrian/Chaldean/SyriacAustralianAustrianBahamianBangladeshiBarbadianBasqueBelgianBelizeanBermudanBhutaneseBlackfeetBolivianBrazilianBritishBritish West IndianBulgarianBurmeseCajunCambodianCanadianCape VerdeanCarpatho RusynCelticCentral AmericanCentral American IndianCherokeeCheyenneChickasawChileanChineseChippewaChoctawColombianColvilleComancheCosta RicanCreeCreekCroatianCrowCubanCypriotCzechCzechoslovakianDanishDelawareDominicanDutchDutch West IndianEastern EuropeanEcuadorianEgyptianEnglishEstonianEthiopianEuropeanFijianFilipinoFinnishFrenchFrench American IndianFrench CanadianGermanGerman RussianGhanaianGreekGuamanian/ChamorroGuatemalanGuyaneseHaitianHmongHonduranHopiHoumaHungarianIcelanderIndian (Asian)IndonesianInupiatIranianIraqiIrishIroquoisIsraeliItalianJamaicanJapaneseJordanianKenyanKiowaKoreanLaotianLatvianLebaneseLiberianLithuanianLumbeeLuxembourgerMacedonianMalaysianMalteseMarshalleseMenomineeMexicanMexican American IndianMongolianMoroccanNavajoNepaleseNew ZealanderNicaraguanNigerianNorthern EuropeanNorwegianOkinawanOsageOttawaPaiutePakistaniPalestinianPanamanianParaguayanPennsylvania GermanPeruvianPimaPolishPortuguesePotawatomiPuebloPuerto RicanPuget Sound SalishRomanianRussianSalvadoranSamoanScandinavianScotch-IrishScottishSeminoleSenegaleseSerbianShoshoneSierra LeoneanSiouxSlavicSlovakSloveneSomaliSouth AfricanSouth AmericanSouth American IndianSoviet UnionSpaniardSpanishSpanish AmericanSpanish American IndianSri LankanSubsaharan AfricanSudaneseSwedishSwissSyrianTaiwaneseThaiTlingit-HaidaTohono O'OdhamTonganTrinidadian and TobagonianTsimshianTurkishU.S. Virgin IslanderUgandanUkrainianUruguayanUteVenezuelanVietnameseWelshWest IndianYakamaYaquiYugoslavianYumanYup'ikZimbabwean
Immigration
NonimmigrantsImmigrantsAfghanistanAfricaAlbaniaArgentinaArmeniaAsiaAustraliaAustriaBahamasBangladeshBarbadosBelarusBelgiumBelizeBoliviaBosnia and HerzegovinaBrazilBulgariaBurma/MyanmarCabo VerdeCambodiaCameroonCanadaCaribbeanCentral AmericaChileChinaColombiaCongoCosta RicaCroatiaCubaCzechoslovakiaDenmarkDominicaDominican RepublicEastern AfricaEastern AsiaEastern EuropeEcuadorEgyptEl SalvadorEnglandEritreaEthiopiaEuropeFijiFranceGermanyGhanaGreeceGrenadaGuatemalaGuyanaHaitiHondurasHong KongHungaryIndiaIndonesiaIranIraqIrelandIsraelItalyJamaicaJapanJordanKazakhstanKenyaKoreaKuwaitLaosLatin AmericaLatviaLebanonLiberiaLithuaniaMalaysiaMexicoMicronesiaMiddle AfricaMoldovaMoroccoNepalNetherlandsNicaraguaNigeriaNorth AmericaNorth MacedoniaNorthern AfricaNorthern EuropeNorwayOceaniaPakistanPanamaPeruPhilippinesPolandPortugalRomaniaRussiaSaudi ArabiaScotlandSenegalSerbiaSierra LeoneSingaporeSomaliaSouth AfricaSouth AmericaSouth Central AsiaSouth Eastern AsiaSouthern EuropeSpainSri LankaSt. Vincent and the GrenadinesSudanSwedenSwitzerlandSyriaTaiwanThailandTrinidad and TobagoTurkeyUgandaUkraineUruguayUzbekistanVenezuelaVietnamWest IndiesWestern AfricaWestern AsiaWestern EuropeYemenZaireZimbabweAzores
Native Hawaiian
Race
Ancestry
AfghanAfricanAlaska NativeAlaskan AthabascanAlbanianAleutAlsatianAmericanApacheArabArapahoArgentineanArmenianAssyrian/Chaldean/SyriacAustralianAustrianBahamianBangladeshiBarbadianBasqueBelgianBelizeanBermudanBhutaneseBlackfeetBolivianBrazilianBritishBritish West IndianBulgarianBurmeseCajunCambodianCanadianCape VerdeanCarpatho RusynCelticCentral AmericanCentral American IndianCherokeeCheyenneChickasawChileanChineseChippewaChoctawColombianColvilleComancheCosta RicanCreeCreekCroatianCrowCubanCypriotCzechCzechoslovakianDanishDelawareDominicanDutchDutch West IndianEastern EuropeanEcuadorianEgyptianEnglishEstonianEthiopianEuropeanFijianFilipinoFinnishFrenchFrench American IndianFrench CanadianGermanGerman RussianGhanaianGreekGuamanian/ChamorroGuatemalanGuyaneseHaitianHmongHonduranHopiHoumaHungarianIcelanderIndian (Asian)IndonesianInupiatIranianIraqiIrishIroquoisIsraeliItalianJamaicanJapaneseJordanianKenyanKiowaKoreanLaotianLatvianLebaneseLiberianLithuanianLumbeeLuxembourgerMacedonianMalaysianMalteseMarshalleseMenomineeMexicanMexican American IndianMongolianMoroccanNative HawaiianNavajoNepaleseNew ZealanderNicaraguanNigerianNorthern EuropeanNorwegianOkinawanOsageOttawaPaiutePakistaniPalestinianPanamanianParaguayanPennsylvania GermanPeruvianPimaPolishPortuguesePotawatomiPuebloPuerto RicanPuget Sound SalishRomanianRussianSalvadoranSamoanScandinavianScotch-IrishScottishSeminoleSenegaleseSerbianShoshoneSierra LeoneanSiouxSlavicSlovakSloveneSomaliSouth AfricanSouth AmericanSouth American IndianSoviet UnionSpaniardSpanishSpanish AmericanSpanish American IndianSri LankanSubsaharan AfricanSudaneseSwedishSwissSyrianTaiwaneseThaiTlingit-HaidaTohono O'OdhamTonganTrinidadian and TobagonianTsimshianTurkishU.S. Virgin IslanderUgandanUkrainianUruguayanUteVenezuelanVietnameseWelshWest IndianYakamaYaquiYugoslavianYumanYup'ikZimbabwean
Immigration
ImmigrantsAfghanistanAfricaAlbaniaArgentinaArmeniaAsiaAustraliaAustriaBahamasBangladeshBarbadosBelarusBelgiumBelizeBoliviaBosnia and HerzegovinaBrazilBulgariaBurma/MyanmarCabo VerdeCambodiaCameroonCanadaCaribbeanCentral AmericaChileChinaColombiaCongoCosta RicaCroatiaCubaCzechoslovakiaDenmarkDominicaDominican RepublicEastern AfricaEastern AsiaEastern EuropeEcuadorEgyptEl SalvadorEnglandEritreaEthiopiaEuropeFijiFranceGermanyGhanaGreeceGrenadaGuatemalaGuyanaHaitiHondurasHong KongHungaryIndiaIndonesiaIranIraqIrelandIsraelItalyJamaicaJapanJordanKazakhstanKenyaKoreaKuwaitLaosLatin AmericaLatviaLebanonLiberiaLithuaniaMalaysiaMexicoMicronesiaMiddle AfricaMoldovaMoroccoNepalNetherlandsNicaraguaNigeriaNorth AmericaNorth MacedoniaNorthern AfricaNorthern EuropeNorwayOceaniaPakistanPanamaPeruPhilippinesPolandPortugalRomaniaRussiaSaudi ArabiaScotlandSenegalSerbiaSierra LeoneSingaporeSomaliaSouth AfricaSouth AmericaSouth Central AsiaSouth Eastern AsiaSouthern EuropeSpainSri LankaSt. Vincent and the GrenadinesSudanSwedenSwitzerlandSyriaTaiwanThailandTrinidad and TobagoTurkeyUgandaUkraineUruguayUzbekistanVenezuelaVietnamWest IndiesWestern AfricaWestern AsiaWestern EuropeYemenZaireZimbabweAzores
11th Grade
Income
Poverty
Unemployment
Labor Participation
Family Structure
Vehicle Availability
Education Level
Disability

11th Grade Comparison

Nonimmigrants

Native Hawaiians

Good
Exceptional
92.7%
11TH GRADE
66.6/ 100
METRIC RATING
163rd/ 347
METRIC RANK
93.9%
11TH GRADE
99.8/ 100
METRIC RATING
65th/ 347
METRIC RANK

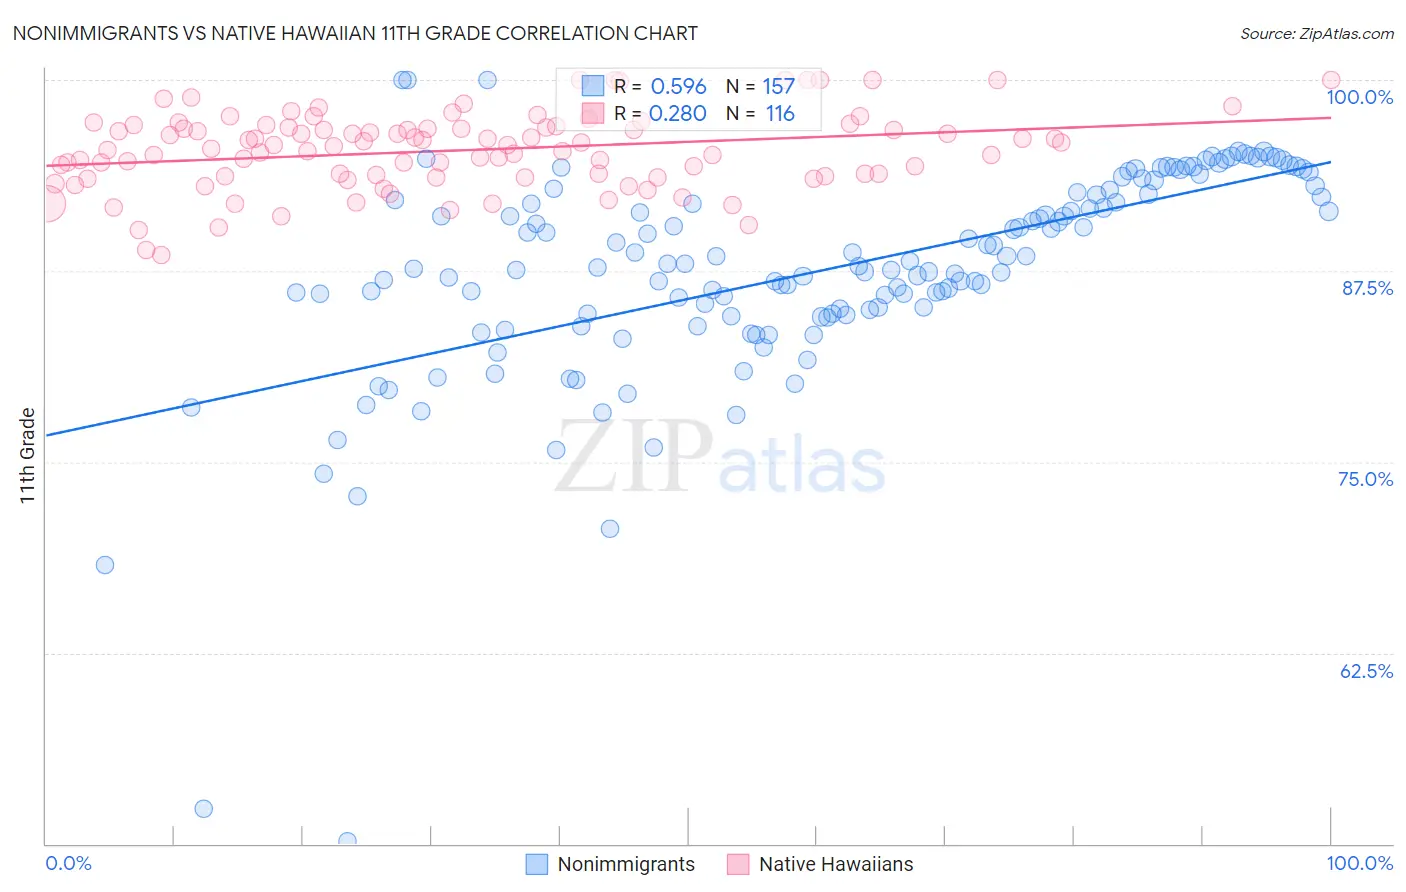
Nonimmigrants vs Native Hawaiian 11th Grade Correlation Chart

The statistical analysis conducted on geographies consisting of 585,371,149 people shows a substantial positive correlation between the proportion of Nonimmigrants and percentage of population with at least 11th grade education in the United States with a correlation coefficient (R) of 0.596 and weighted average of 92.7%. Similarly, the statistical analysis conducted on geographies consisting of 332,119,254 people shows a weak positive correlation between the proportion of Native Hawaiians and percentage of population with at least 11th grade education in the United States with a correlation coefficient (R) of 0.280 and weighted average of 93.9%, a difference of 1.4%.
Nonimmigrants vs Native Hawaiian 11th Grade

11th Grade Correlation Summary

MeasurementNonimmigrantsNative Hawaiian
Minimum50.2%88.5%
Maximum100.0%100.0%
Range49.8%11.5%
Mean87.5%95.4%
Median87.8%95.7%
Interquartile 25% (IQ1)84.6%93.7%
Interquartile 75% (IQ3)92.5%96.9%
Interquartile Range (IQR)7.9%3.2%
Standard Deviation (Sample)7.1%2.5%
Standard Deviation (Population)7.1%2.5%

Similar Demographics by 11th Grade

Demographics Similar to Nonimmigrants by 11th Grade

In terms of 11th grade, the demographic groups most similar to Nonimmigrants are Spanish (92.7%, a difference of 0.0%), Paraguayan (92.7%, a difference of 0.020%), Immigrants from Iraq (92.6%, a difference of 0.030%), Immigrants from Argentina (92.7%, a difference of 0.040%), and Immigrants from Lebanon (92.7%, a difference of 0.050%).
DemographicsRating | Rank11th Grade
Immigrants | Spain
73.0
/100
|
#156
Good
92.7%
Immigrants | Eastern Asia
72.6
/100
|
#157
Good
92.7%
Immigrants | Venezuela
72.0
/100
|
#158
Good
92.7%
Americans
71.7
/100
|
#159
Good
92.7%
Immigrants | Lebanon
70.7
/100
|
#160
Good
92.7%
Immigrants | Argentina
69.8
/100
|
#161
Good
92.7%
Paraguayans
68.7
/100
|
#162
Good
92.7%
Immigrants | Nonimmigrants
66.6
/100
|
#163
Good
92.7%
Spanish
66.2
/100
|
#164
Good
92.7%
Immigrants | Iraq
63.7
/100
|
#165
Good
92.6%
Bermudans
62.3
/100
|
#166
Good
92.6%
Alsatians
60.2
/100
|
#167
Good
92.6%
Sierra Leoneans
58.7
/100
|
#168
Average
92.6%
Immigrants | Albania
57.8
/100
|
#169
Average
92.6%
Immigrants | Northern Africa
57.3
/100
|
#170
Average
92.6%

Demographics Similar to Native Hawaiians by 11th Grade

In terms of 11th grade, the demographic groups most similar to Native Hawaiians are Immigrants from Sweden (93.9%, a difference of 0.0%), Alaskan Athabascan (93.9%, a difference of 0.020%), Immigrants from Netherlands (93.9%, a difference of 0.020%), Ukrainian (94.0%, a difference of 0.030%), and Zimbabwean (93.9%, a difference of 0.040%).
DemographicsRating | Rank11th Grade
Iranians
99.9
/100
|
#58
Exceptional
94.0%
Bhutanese
99.8
/100
|
#59
Exceptional
94.0%
Okinawans
99.8
/100
|
#60
Exceptional
94.0%
Immigrants | Belgium
99.8
/100
|
#61
Exceptional
94.0%
Austrians
99.8
/100
|
#62
Exceptional
94.0%
Ukrainians
99.8
/100
|
#63
Exceptional
94.0%
Immigrants | Sweden
99.8
/100
|
#64
Exceptional
93.9%
Native Hawaiians
99.8
/100
|
#65
Exceptional
93.9%
Alaskan Athabascans
99.8
/100
|
#66
Exceptional
93.9%
Immigrants | Netherlands
99.8
/100
|
#67
Exceptional
93.9%
Zimbabweans
99.8
/100
|
#68
Exceptional
93.9%
Scotch-Irish
99.8
/100
|
#69
Exceptional
93.9%
Immigrants | England
99.7
/100
|
#70
Exceptional
93.8%
Immigrants | South Africa
99.7
/100
|
#71
Exceptional
93.8%
Immigrants | Japan
99.7
/100
|
#72
Exceptional
93.8%