Nonimmigrants vs Immigrants from Zimbabwe 9th Grade
COMPARE
Nonimmigrants
Immigrants from Zimbabwe
9th Grade
9th Grade Comparison
Nonimmigrants
Immigrants from Zimbabwe
95.3%
9TH GRADE
92.0/ 100
METRIC RATING
132nd/ 347
METRIC RANK
95.5%
9TH GRADE
96.9/ 100
METRIC RATING
107th/ 347
METRIC RANK
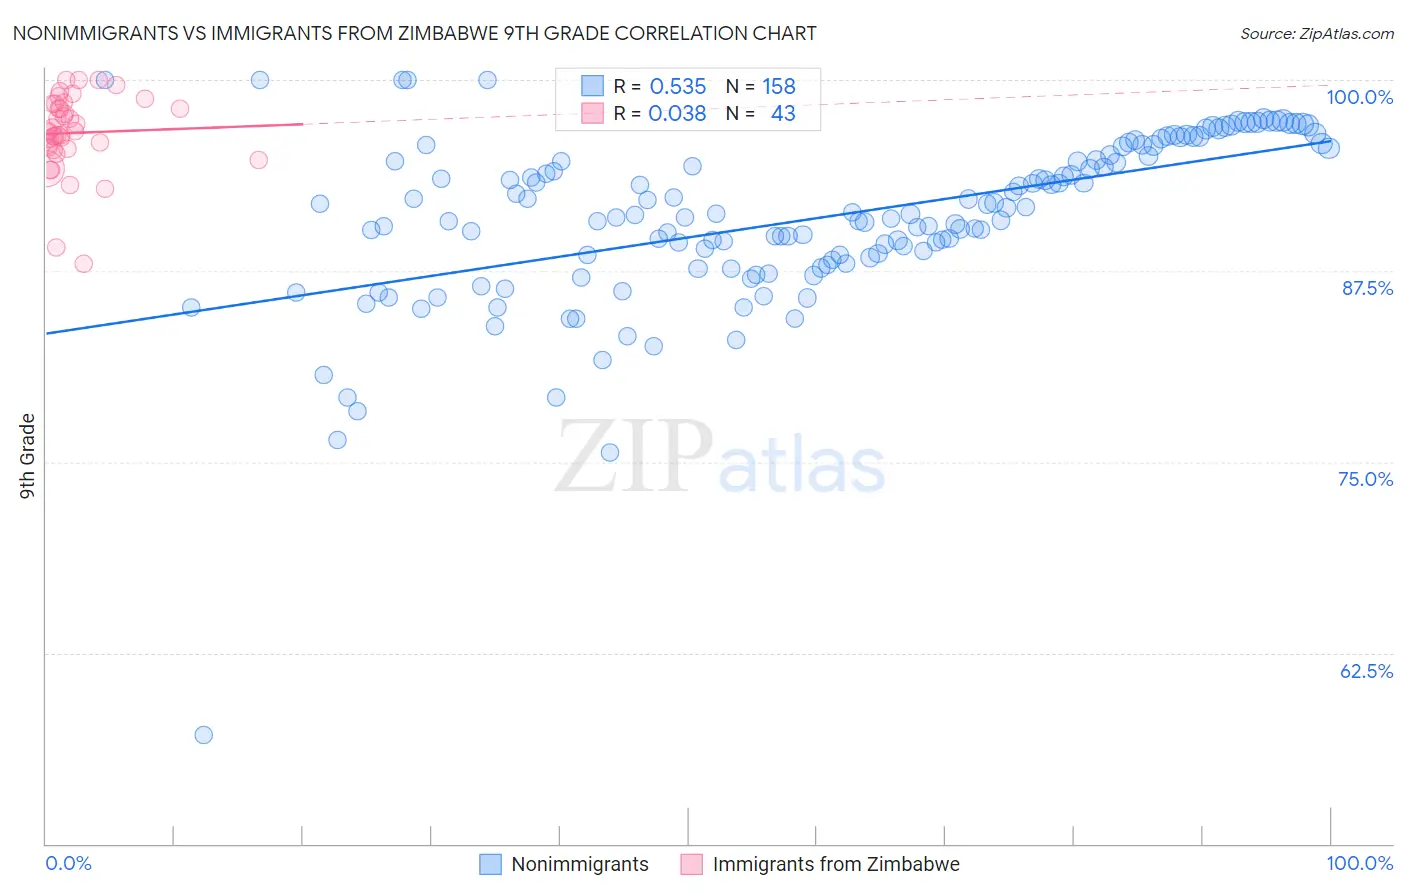
Nonimmigrants vs Immigrants from Zimbabwe 9th Grade Correlation Chart
The statistical analysis conducted on geographies consisting of 585,372,544 people shows a substantial positive correlation between the proportion of Nonimmigrants and percentage of population with at least 9th grade education in the United States with a correlation coefficient (R) of 0.535 and weighted average of 95.3%. Similarly, the statistical analysis conducted on geographies consisting of 117,809,691 people shows no correlation between the proportion of Immigrants from Zimbabwe and percentage of population with at least 9th grade education in the United States with a correlation coefficient (R) of 0.038 and weighted average of 95.5%, a difference of 0.18%.
9th Grade Correlation Summary
| Measurement | Nonimmigrants | Immigrants from Zimbabwe |
| Minimum | 57.2% | 88.0% |
| Maximum | 100.0% | 100.0% |
| Range | 42.8% | 12.0% |
| Mean | 91.0% | 96.5% |
| Median | 91.2% | 96.7% |
| Interquartile 25% (IQ1) | 88.2% | 95.5% |
| Interquartile 75% (IQ3) | 95.0% | 98.4% |
| Interquartile Range (IQR) | 6.8% | 2.9% |
| Standard Deviation (Sample) | 5.6% | 2.6% |
| Standard Deviation (Population) | 5.6% | 2.5% |
Similar Demographics by 9th Grade
Demographics Similar to Nonimmigrants by 9th Grade
In terms of 9th grade, the demographic groups most similar to Nonimmigrants are Immigrants from North Macedonia (95.3%, a difference of 0.010%), Israeli (95.3%, a difference of 0.030%), Jordanian (95.3%, a difference of 0.040%), Immigrants from Israel (95.3%, a difference of 0.050%), and Immigrants from Hungary (95.4%, a difference of 0.060%).
| Demographics | Rating | Rank | 9th Grade |
| Immigrants | South Central Asia | 95.1 /100 | #125 | Exceptional 95.4% |
| Immigrants | Serbia | 94.4 /100 | #126 | Exceptional 95.4% |
| Palestinians | 94.3 /100 | #127 | Exceptional 95.4% |
| Immigrants | Hungary | 94.2 /100 | #128 | Exceptional 95.4% |
| Basques | 94.1 /100 | #129 | Exceptional 95.4% |
| Jordanians | 93.5 /100 | #130 | Exceptional 95.3% |
| Immigrants | North Macedonia | 92.3 /100 | #131 | Exceptional 95.3% |
| Immigrants | Nonimmigrants | 92.0 /100 | #132 | Exceptional 95.3% |
| Israelis | 90.4 /100 | #133 | Exceptional 95.3% |
| Immigrants | Israel | 89.6 /100 | #134 | Excellent 95.3% |
| Immigrants | Belarus | 88.9 /100 | #135 | Excellent 95.2% |
| Immigrants | Iran | 88.3 /100 | #136 | Excellent 95.2% |
| Hmong | 87.7 /100 | #137 | Excellent 95.2% |
| Immigrants | Russia | 86.6 /100 | #138 | Excellent 95.2% |
| Immigrants | Eastern Europe | 85.8 /100 | #139 | Excellent 95.2% |
Demographics Similar to Immigrants from Zimbabwe by 9th Grade
In terms of 9th grade, the demographic groups most similar to Immigrants from Zimbabwe are Chickasaw (95.5%, a difference of 0.0%), Osage (95.5%, a difference of 0.010%), Immigrants from Bulgaria (95.5%, a difference of 0.010%), Immigrants from Norway (95.5%, a difference of 0.020%), and Syrian (95.5%, a difference of 0.030%).
| Demographics | Rating | Rank | 9th Grade |
| Lebanese | 98.1 /100 | #100 | Exceptional 95.6% |
| Immigrants | Moldova | 97.9 /100 | #101 | Exceptional 95.5% |
| Immigrants | Switzerland | 97.7 /100 | #102 | Exceptional 95.5% |
| Potawatomi | 97.7 /100 | #103 | Exceptional 95.5% |
| Syrians | 97.4 /100 | #104 | Exceptional 95.5% |
| Immigrants | France | 97.4 /100 | #105 | Exceptional 95.5% |
| Immigrants | Norway | 97.1 /100 | #106 | Exceptional 95.5% |
| Immigrants | Zimbabwe | 96.9 /100 | #107 | Exceptional 95.5% |
| Chickasaw | 96.8 /100 | #108 | Exceptional 95.5% |
| Osage | 96.8 /100 | #109 | Exceptional 95.5% |
| Immigrants | Bulgaria | 96.7 /100 | #110 | Exceptional 95.5% |
| Cherokee | 96.3 /100 | #111 | Exceptional 95.4% |
| Immigrants | Croatia | 96.2 /100 | #112 | Exceptional 95.4% |
| Iroquois | 96.2 /100 | #113 | Exceptional 95.4% |
| German Russians | 96.1 /100 | #114 | Exceptional 95.4% |