Nicaraguan vs Spaniard 10th Grade
COMPARE
Nicaraguan
Spaniard
10th Grade
10th Grade Comparison
Nicaraguans
Spaniards
90.2%
10TH GRADE
0.0/ 100
METRIC RATING
319th/ 347
METRIC RANK
93.7%
10TH GRADE
50.3/ 100
METRIC RATING
173rd/ 347
METRIC RANK
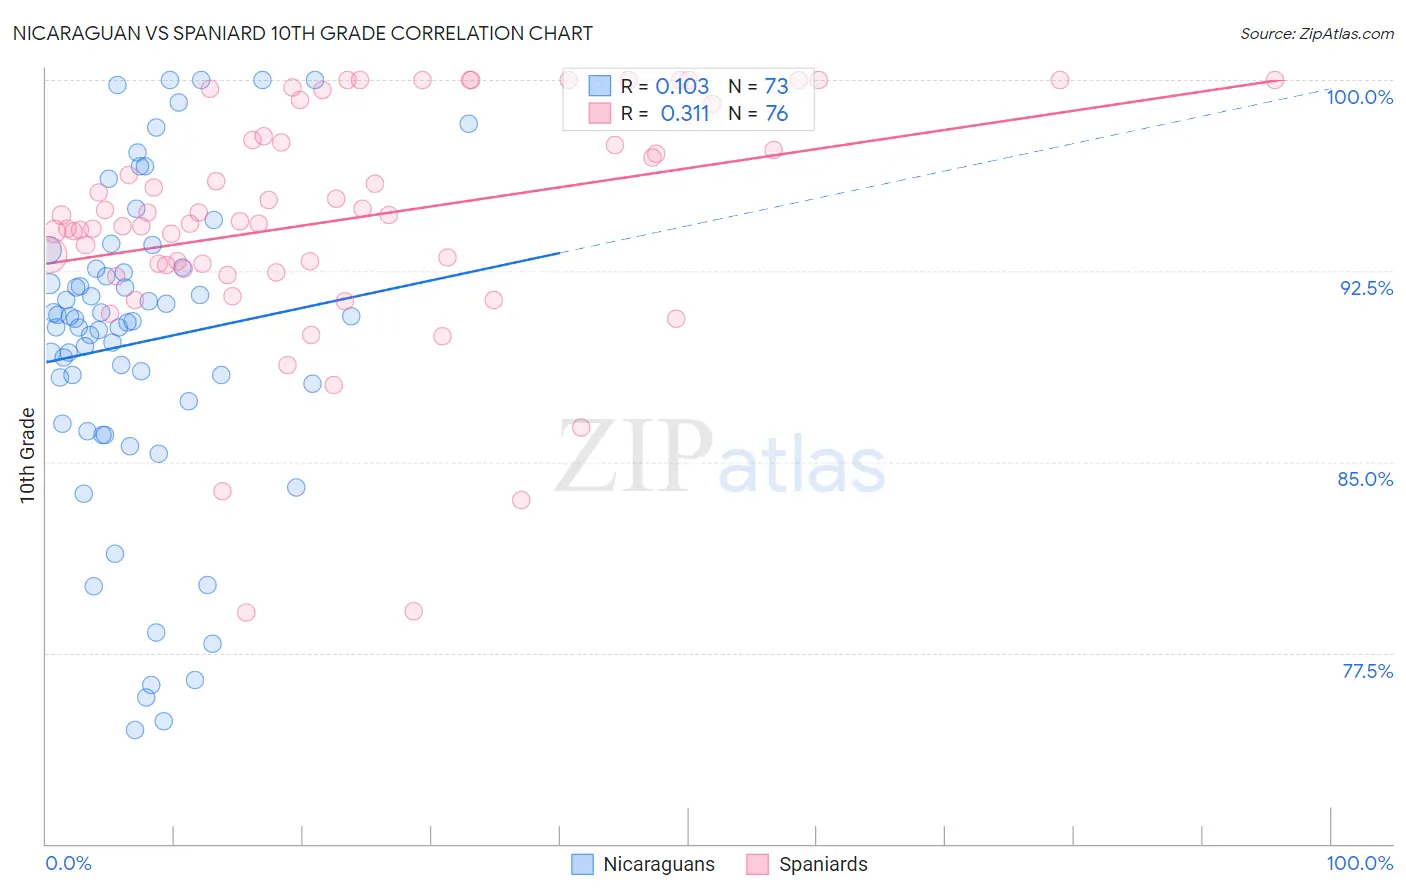
Nicaraguan vs Spaniard 10th Grade Correlation Chart
The statistical analysis conducted on geographies consisting of 285,711,651 people shows a poor positive correlation between the proportion of Nicaraguans and percentage of population with at least 10th grade education in the United States with a correlation coefficient (R) of 0.103 and weighted average of 90.2%. Similarly, the statistical analysis conducted on geographies consisting of 443,545,794 people shows a mild positive correlation between the proportion of Spaniards and percentage of population with at least 10th grade education in the United States with a correlation coefficient (R) of 0.311 and weighted average of 93.7%, a difference of 4.0%.
10th Grade Correlation Summary
| Measurement | Nicaraguan | Spaniard |
| Minimum | 74.5% | 79.1% |
| Maximum | 100.0% | 100.0% |
| Range | 25.5% | 20.9% |
| Mean | 89.7% | 94.5% |
| Median | 90.5% | 94.6% |
| Interquartile 25% (IQ1) | 86.9% | 92.6% |
| Interquartile 75% (IQ3) | 92.6% | 97.7% |
| Interquartile Range (IQR) | 5.7% | 5.1% |
| Standard Deviation (Sample) | 6.3% | 4.6% |
| Standard Deviation (Population) | 6.2% | 4.6% |
Similar Demographics by 10th Grade
Demographics Similar to Nicaraguans by 10th Grade
In terms of 10th grade, the demographic groups most similar to Nicaraguans are Houma (90.2%, a difference of 0.010%), Belizean (90.2%, a difference of 0.010%), Tohono O'odham (90.1%, a difference of 0.020%), Immigrants from Cuba (90.2%, a difference of 0.080%), and Immigrants from Belize (90.1%, a difference of 0.11%).
| Demographics | Rating | Rank | 10th Grade |
| Immigrants | Portugal | 0.0 /100 | #312 | Tragic 90.8% |
| Cape Verdeans | 0.0 /100 | #313 | Tragic 90.8% |
| Nepalese | 0.0 /100 | #314 | Tragic 90.7% |
| Immigrants | Caribbean | 0.0 /100 | #315 | Tragic 90.6% |
| Ecuadorians | 0.0 /100 | #316 | Tragic 90.6% |
| Immigrants | Ecuador | 0.0 /100 | #317 | Tragic 90.4% |
| Immigrants | Cuba | 0.0 /100 | #318 | Tragic 90.2% |
| Nicaraguans | 0.0 /100 | #319 | Tragic 90.2% |
| Houma | 0.0 /100 | #320 | Tragic 90.2% |
| Belizeans | 0.0 /100 | #321 | Tragic 90.2% |
| Tohono O'odham | 0.0 /100 | #322 | Tragic 90.1% |
| Immigrants | Belize | 0.0 /100 | #323 | Tragic 90.1% |
| Immigrants | Armenia | 0.0 /100 | #324 | Tragic 89.9% |
| Puerto Ricans | 0.0 /100 | #325 | Tragic 89.8% |
| Central American Indians | 0.0 /100 | #326 | Tragic 89.7% |
Demographics Similar to Spaniards by 10th Grade
In terms of 10th grade, the demographic groups most similar to Spaniards are Argentinean (93.7%, a difference of 0.0%), French American Indian (93.7%, a difference of 0.010%), Immigrants from Nepal (93.7%, a difference of 0.010%), Immigrants from Albania (93.8%, a difference of 0.020%), and Immigrants from Venezuela (93.8%, a difference of 0.030%).
| Demographics | Rating | Rank | 10th Grade |
| Immigrants | Iraq | 63.0 /100 | #166 | Good 93.8% |
| Immigrants | Egypt | 62.3 /100 | #167 | Good 93.8% |
| Alsatians | 59.4 /100 | #168 | Average 93.8% |
| Immigrants | Spain | 55.9 /100 | #169 | Average 93.8% |
| Immigrants | Venezuela | 53.9 /100 | #170 | Average 93.8% |
| Immigrants | Albania | 52.4 /100 | #171 | Average 93.8% |
| French American Indians | 50.9 /100 | #172 | Average 93.7% |
| Spaniards | 50.3 /100 | #173 | Average 93.7% |
| Argentineans | 50.0 /100 | #174 | Average 93.7% |
| Immigrants | Nepal | 49.6 /100 | #175 | Average 93.7% |
| Immigrants | Argentina | 47.1 /100 | #176 | Average 93.7% |
| Immigrants | Lebanon | 47.1 /100 | #177 | Average 93.7% |
| Sierra Leoneans | 46.1 /100 | #178 | Average 93.7% |
| Paraguayans | 45.3 /100 | #179 | Average 93.7% |
| Blackfeet | 42.8 /100 | #180 | Average 93.7% |