Nicaraguan vs Iroquois 9th Grade

COMPARE

Nicaraguan
Race
Ancestry
AfghanAfricanAlaska NativeAlaskan AthabascanAlbanianAleutAlsatianAmericanApacheArabArapahoArgentineanArmenianAssyrian/Chaldean/SyriacAustralianAustrianBahamianBangladeshiBarbadianBasqueBelgianBelizeanBermudanBhutaneseBlackfeetBolivianBrazilianBritishBritish West IndianBulgarianBurmeseCajunCambodianCanadianCape VerdeanCarpatho RusynCelticCentral AmericanCentral American IndianCherokeeCheyenneChickasawChileanChineseChippewaChoctawColombianColvilleComancheCosta RicanCreeCreekCroatianCrowCubanCypriotCzechCzechoslovakianDanishDelawareDominicanDutchDutch West IndianEastern EuropeanEcuadorianEgyptianEnglishEstonianEthiopianEuropeanFijianFilipinoFinnishFrenchFrench American IndianFrench CanadianGermanGerman RussianGhanaianGreekGuamanian/ChamorroGuatemalanGuyaneseHaitianHmongHonduranHopiHoumaHungarianIcelanderIndian (Asian)IndonesianInupiatIranianIraqiIrishIsraeliItalianJamaicanJapaneseJordanianKenyanKiowaKoreanLaotianLatvianLebaneseLiberianLithuanianLumbeeLuxembourgerMacedonianMalaysianMalteseMarshalleseMenomineeMexicanMexican American IndianMongolianMoroccanNative HawaiianNavajoNepaleseNew ZealanderNicaraguanNigerianNorthern EuropeanNorwegianOkinawanOsageOttawaPaiutePakistaniPalestinianPanamanianParaguayanPennsylvania GermanPeruvianPimaPolishPortuguesePotawatomiPuebloPuerto RicanPuget Sound SalishRomanianRussianSalvadoranSamoanScandinavianScotch-IrishScottishSeminoleSenegaleseSerbianShoshoneSierra LeoneanSiouxSlavicSlovakSloveneSomaliSouth AfricanSouth AmericanSouth American IndianSoviet UnionSpaniardSpanishSpanish AmericanSpanish American IndianSri LankanSubsaharan AfricanSudaneseSwedishSwissSyrianTaiwaneseThaiTlingit-HaidaTohono O'OdhamTonganTrinidadian and TobagonianTsimshianTurkishU.S. Virgin IslanderUgandanUkrainianUruguayanUteVenezuelanVietnameseWelshWest IndianYakamaYaquiYugoslavianYumanYup'ikZimbabwean
Immigration
NonimmigrantsImmigrantsAfghanistanAfricaAlbaniaArgentinaArmeniaAsiaAustraliaAustriaBahamasBangladeshBarbadosBelarusBelgiumBelizeBoliviaBosnia and HerzegovinaBrazilBulgariaBurma/MyanmarCabo VerdeCambodiaCameroonCanadaCaribbeanCentral AmericaChileChinaColombiaCongoCosta RicaCroatiaCubaCzechoslovakiaDenmarkDominicaDominican RepublicEastern AfricaEastern AsiaEastern EuropeEcuadorEgyptEl SalvadorEnglandEritreaEthiopiaEuropeFijiFranceGermanyGhanaGreeceGrenadaGuatemalaGuyanaHaitiHondurasHong KongHungaryIndiaIndonesiaIranIraqIrelandIsraelItalyJamaicaJapanJordanKazakhstanKenyaKoreaKuwaitLaosLatin AmericaLatviaLebanonLiberiaLithuaniaMalaysiaMexicoMicronesiaMiddle AfricaMoldovaMoroccoNepalNetherlandsNicaraguaNigeriaNorth AmericaNorth MacedoniaNorthern AfricaNorthern EuropeNorwayOceaniaPakistanPanamaPeruPhilippinesPolandPortugalRomaniaRussiaSaudi ArabiaScotlandSenegalSerbiaSierra LeoneSingaporeSomaliaSouth AfricaSouth AmericaSouth Central AsiaSouth Eastern AsiaSouthern EuropeSpainSri LankaSt. Vincent and the GrenadinesSudanSwedenSwitzerlandSyriaTaiwanThailandTrinidad and TobagoTurkeyUgandaUkraineUruguayUzbekistanVenezuelaVietnamWest IndiesWestern AfricaWestern AsiaWestern EuropeYemenZaireZimbabweAzores
Iroquois
Race
Ancestry
AfghanAfricanAlaska NativeAlaskan AthabascanAlbanianAleutAlsatianAmericanApacheArabArapahoArgentineanArmenianAssyrian/Chaldean/SyriacAustralianAustrianBahamianBangladeshiBarbadianBasqueBelgianBelizeanBermudanBhutaneseBlackfeetBolivianBrazilianBritishBritish West IndianBulgarianBurmeseCajunCambodianCanadianCape VerdeanCarpatho RusynCelticCentral AmericanCentral American IndianCherokeeCheyenneChickasawChileanChineseChippewaChoctawColombianColvilleComancheCosta RicanCreeCreekCroatianCrowCubanCypriotCzechCzechoslovakianDanishDelawareDominicanDutchDutch West IndianEastern EuropeanEcuadorianEgyptianEnglishEstonianEthiopianEuropeanFijianFilipinoFinnishFrenchFrench American IndianFrench CanadianGermanGerman RussianGhanaianGreekGuamanian/ChamorroGuatemalanGuyaneseHaitianHmongHonduranHopiHoumaHungarianIcelanderIndian (Asian)IndonesianInupiatIranianIraqiIrishIroquoisIsraeliItalianJamaicanJapaneseJordanianKenyanKiowaKoreanLaotianLatvianLebaneseLiberianLithuanianLumbeeLuxembourgerMacedonianMalaysianMalteseMarshalleseMenomineeMexicanMexican American IndianMongolianMoroccanNative HawaiianNavajoNepaleseNew ZealanderNigerianNorthern EuropeanNorwegianOkinawanOsageOttawaPaiutePakistaniPalestinianPanamanianParaguayanPennsylvania GermanPeruvianPimaPolishPortuguesePotawatomiPuebloPuerto RicanPuget Sound SalishRomanianRussianSalvadoranSamoanScandinavianScotch-IrishScottishSeminoleSenegaleseSerbianShoshoneSierra LeoneanSiouxSlavicSlovakSloveneSomaliSouth AfricanSouth AmericanSouth American IndianSoviet UnionSpaniardSpanishSpanish AmericanSpanish American IndianSri LankanSubsaharan AfricanSudaneseSwedishSwissSyrianTaiwaneseThaiTlingit-HaidaTohono O'OdhamTonganTrinidadian and TobagonianTsimshianTurkishU.S. Virgin IslanderUgandanUkrainianUruguayanUteVenezuelanVietnameseWelshWest IndianYakamaYaquiYugoslavianYumanYup'ikZimbabwean
Immigration
NonimmigrantsImmigrantsAfghanistanAfricaAlbaniaArgentinaArmeniaAsiaAustraliaAustriaBahamasBangladeshBarbadosBelarusBelgiumBelizeBoliviaBosnia and HerzegovinaBrazilBulgariaBurma/MyanmarCabo VerdeCambodiaCameroonCanadaCaribbeanCentral AmericaChileChinaColombiaCongoCosta RicaCroatiaCubaCzechoslovakiaDenmarkDominicaDominican RepublicEastern AfricaEastern AsiaEastern EuropeEcuadorEgyptEl SalvadorEnglandEritreaEthiopiaEuropeFijiFranceGermanyGhanaGreeceGrenadaGuatemalaGuyanaHaitiHondurasHong KongHungaryIndiaIndonesiaIranIraqIrelandIsraelItalyJamaicaJapanJordanKazakhstanKenyaKoreaKuwaitLaosLatin AmericaLatviaLebanonLiberiaLithuaniaMalaysiaMexicoMicronesiaMiddle AfricaMoldovaMoroccoNepalNetherlandsNicaraguaNigeriaNorth AmericaNorth MacedoniaNorthern AfricaNorthern EuropeNorwayOceaniaPakistanPanamaPeruPhilippinesPolandPortugalRomaniaRussiaSaudi ArabiaScotlandSenegalSerbiaSierra LeoneSingaporeSomaliaSouth AfricaSouth AmericaSouth Central AsiaSouth Eastern AsiaSouthern EuropeSpainSri LankaSt. Vincent and the GrenadinesSudanSwedenSwitzerlandSyriaTaiwanThailandTrinidad and TobagoTurkeyUgandaUkraineUruguayUzbekistanVenezuelaVietnamWest IndiesWestern AfricaWestern AsiaWestern EuropeYemenZaireZimbabweAzores
9th Grade
Income
Poverty
Unemployment
Labor Participation
Family Structure
Vehicle Availability
Education Level
Disability

9th Grade Comparison

Nicaraguans

Iroquois

Tragic
Exceptional
91.9%
9TH GRADE
0.0/ 100
METRIC RATING
320th/ 347
METRIC RANK
95.4%
9TH GRADE
96.2/ 100
METRIC RATING
113th/ 347
METRIC RANK

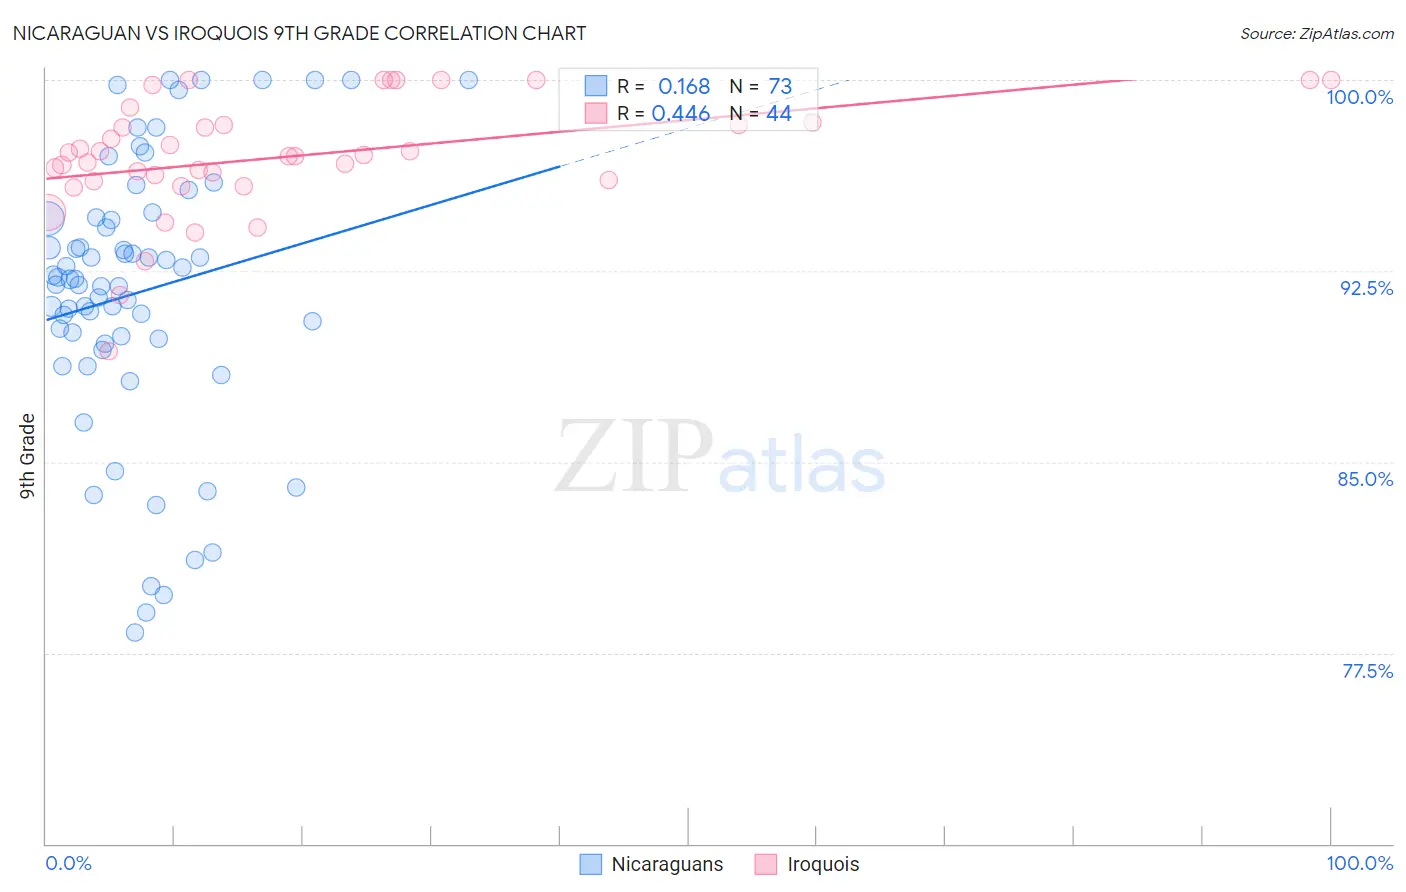
Nicaraguan vs Iroquois 9th Grade Correlation Chart

The statistical analysis conducted on geographies consisting of 285,711,651 people shows a poor positive correlation between the proportion of Nicaraguans and percentage of population with at least 9th grade education in the United States with a correlation coefficient (R) of 0.168 and weighted average of 91.9%. Similarly, the statistical analysis conducted on geographies consisting of 207,308,056 people shows a moderate positive correlation between the proportion of Iroquois and percentage of population with at least 9th grade education in the United States with a correlation coefficient (R) of 0.446 and weighted average of 95.4%, a difference of 3.8%.
Nicaraguan vs Iroquois 9th Grade

9th Grade Correlation Summary

MeasurementNicaraguanIroquois
Minimum78.3%89.4%
Maximum100.0%100.0%
Range21.7%10.6%
Mean91.7%97.0%
Median92.2%97.0%
Interquartile 25% (IQ1)89.8%96.1%
Interquartile 75% (IQ3)94.6%98.3%
Interquartile Range (IQR)4.8%2.2%
Standard Deviation (Sample)5.4%2.3%
Standard Deviation (Population)5.3%2.3%

Similar Demographics by 9th Grade

Demographics Similar to Nicaraguans by 9th Grade

In terms of 9th grade, the demographic groups most similar to Nicaraguans are Ecuadorian (91.9%, a difference of 0.040%), Immigrants from Ecuador (91.8%, a difference of 0.070%), Nepalese (92.0%, a difference of 0.090%), Belizean (91.8%, a difference of 0.090%), and Puerto Rican (91.8%, a difference of 0.090%).
DemographicsRating | Rank9th Grade
Vietnamese
0.0
/100
|
#313
Tragic
92.3%
Immigrants | Portugal
0.0
/100
|
#314
Tragic
92.2%
Immigrants | Caribbean
0.0
/100
|
#315
Tragic
92.2%
Cape Verdeans
0.0
/100
|
#316
Tragic
92.2%
Immigrants | Cuba
0.0
/100
|
#317
Tragic
92.2%
Nepalese
0.0
/100
|
#318
Tragic
92.0%
Ecuadorians
0.0
/100
|
#319
Tragic
91.9%
Nicaraguans
0.0
/100
|
#320
Tragic
91.9%
Immigrants | Ecuador
0.0
/100
|
#321
Tragic
91.8%
Belizeans
0.0
/100
|
#322
Tragic
91.8%
Puerto Ricans
0.0
/100
|
#323
Tragic
91.8%
Immigrants | Belize
0.0
/100
|
#324
Tragic
91.8%
Central American Indians
0.0
/100
|
#325
Tragic
91.5%
Immigrants | Armenia
0.0
/100
|
#326
Tragic
91.4%
Immigrants | Nicaragua
0.0
/100
|
#327
Tragic
91.3%

Demographics Similar to Iroquois by 9th Grade

In terms of 9th grade, the demographic groups most similar to Iroquois are Immigrants from Croatia (95.4%, a difference of 0.0%), German Russian (95.4%, a difference of 0.0%), Cherokee (95.4%, a difference of 0.010%), Burmese (95.4%, a difference of 0.010%), and Immigrants from Europe (95.4%, a difference of 0.020%).
DemographicsRating | Rank9th Grade
Immigrants | Norway
97.1
/100
|
#106
Exceptional
95.5%
Immigrants | Zimbabwe
96.9
/100
|
#107
Exceptional
95.5%
Chickasaw
96.8
/100
|
#108
Exceptional
95.5%
Osage
96.8
/100
|
#109
Exceptional
95.5%
Immigrants | Bulgaria
96.7
/100
|
#110
Exceptional
95.5%
Cherokee
96.3
/100
|
#111
Exceptional
95.4%
Immigrants | Croatia
96.2
/100
|
#112
Exceptional
95.4%
Iroquois
96.2
/100
|
#113
Exceptional
95.4%
German Russians
96.1
/100
|
#114
Exceptional
95.4%
Burmese
96.0
/100
|
#115
Exceptional
95.4%
Immigrants | Europe
95.7
/100
|
#116
Exceptional
95.4%
Immigrants | Romania
95.6
/100
|
#117
Exceptional
95.4%
Immigrants | Turkey
95.6
/100
|
#118
Exceptional
95.4%
Soviet Union
95.6
/100
|
#119
Exceptional
95.4%
Cambodians
95.6
/100
|
#120
Exceptional
95.4%