Nicaraguan vs Immigrants from Italy 4th Grade

COMPARE

Nicaraguan
Race
Ancestry
AfghanAfricanAlaska NativeAlaskan AthabascanAlbanianAleutAlsatianAmericanApacheArabArapahoArgentineanArmenianAssyrian/Chaldean/SyriacAustralianAustrianBahamianBangladeshiBarbadianBasqueBelgianBelizeanBermudanBhutaneseBlackfeetBolivianBrazilianBritishBritish West IndianBulgarianBurmeseCajunCambodianCanadianCape VerdeanCarpatho RusynCelticCentral AmericanCentral American IndianCherokeeCheyenneChickasawChileanChineseChippewaChoctawColombianColvilleComancheCosta RicanCreeCreekCroatianCrowCubanCypriotCzechCzechoslovakianDanishDelawareDominicanDutchDutch West IndianEastern EuropeanEcuadorianEgyptianEnglishEstonianEthiopianEuropeanFijianFilipinoFinnishFrenchFrench American IndianFrench CanadianGermanGerman RussianGhanaianGreekGuamanian/ChamorroGuatemalanGuyaneseHaitianHmongHonduranHopiHoumaHungarianIcelanderIndian (Asian)IndonesianInupiatIranianIraqiIrishIroquoisIsraeliItalianJamaicanJapaneseJordanianKenyanKiowaKoreanLaotianLatvianLebaneseLiberianLithuanianLumbeeLuxembourgerMacedonianMalaysianMalteseMarshalleseMenomineeMexicanMexican American IndianMongolianMoroccanNative HawaiianNavajoNepaleseNew ZealanderNicaraguanNigerianNorthern EuropeanNorwegianOkinawanOsageOttawaPaiutePakistaniPalestinianPanamanianParaguayanPennsylvania GermanPeruvianPimaPolishPortuguesePotawatomiPuebloPuerto RicanPuget Sound SalishRomanianRussianSalvadoranSamoanScandinavianScotch-IrishScottishSeminoleSenegaleseSerbianShoshoneSierra LeoneanSiouxSlavicSlovakSloveneSomaliSouth AfricanSouth AmericanSouth American IndianSoviet UnionSpaniardSpanishSpanish AmericanSpanish American IndianSri LankanSubsaharan AfricanSudaneseSwedishSwissSyrianTaiwaneseThaiTlingit-HaidaTohono O'OdhamTonganTrinidadian and TobagonianTsimshianTurkishU.S. Virgin IslanderUgandanUkrainianUruguayanUteVenezuelanVietnameseWelshWest IndianYakamaYaquiYugoslavianYumanYup'ikZimbabwean
Immigration
NonimmigrantsImmigrantsAfghanistanAfricaAlbaniaArgentinaArmeniaAsiaAustraliaAustriaBahamasBangladeshBarbadosBelarusBelgiumBelizeBoliviaBosnia and HerzegovinaBrazilBulgariaBurma/MyanmarCabo VerdeCambodiaCameroonCanadaCaribbeanCentral AmericaChileChinaColombiaCongoCosta RicaCroatiaCubaCzechoslovakiaDenmarkDominicaDominican RepublicEastern AfricaEastern AsiaEastern EuropeEcuadorEgyptEl SalvadorEnglandEritreaEthiopiaEuropeFijiFranceGermanyGhanaGreeceGrenadaGuatemalaGuyanaHaitiHondurasHong KongHungaryIndiaIndonesiaIranIraqIrelandIsraelJamaicaJapanJordanKazakhstanKenyaKoreaKuwaitLaosLatin AmericaLatviaLebanonLiberiaLithuaniaMalaysiaMexicoMicronesiaMiddle AfricaMoldovaMoroccoNepalNetherlandsNicaraguaNigeriaNorth AmericaNorth MacedoniaNorthern AfricaNorthern EuropeNorwayOceaniaPakistanPanamaPeruPhilippinesPolandPortugalRomaniaRussiaSaudi ArabiaScotlandSenegalSerbiaSierra LeoneSingaporeSomaliaSouth AfricaSouth AmericaSouth Central AsiaSouth Eastern AsiaSouthern EuropeSpainSri LankaSt. Vincent and the GrenadinesSudanSwedenSwitzerlandSyriaTaiwanThailandTrinidad and TobagoTurkeyUgandaUkraineUruguayUzbekistanVenezuelaVietnamWest IndiesWestern AfricaWestern AsiaWestern EuropeYemenZaireZimbabweAzores
Immigrants from Italy
Race
Ancestry
AfghanAfricanAlaska NativeAlaskan AthabascanAlbanianAleutAlsatianAmericanApacheArabArapahoArgentineanArmenianAssyrian/Chaldean/SyriacAustralianAustrianBahamianBangladeshiBarbadianBasqueBelgianBelizeanBermudanBhutaneseBlackfeetBolivianBrazilianBritishBritish West IndianBulgarianBurmeseCajunCambodianCanadianCape VerdeanCarpatho RusynCelticCentral AmericanCentral American IndianCherokeeCheyenneChickasawChileanChineseChippewaChoctawColombianColvilleComancheCosta RicanCreeCreekCroatianCrowCubanCypriotCzechCzechoslovakianDanishDelawareDominicanDutchDutch West IndianEastern EuropeanEcuadorianEgyptianEnglishEstonianEthiopianEuropeanFijianFilipinoFinnishFrenchFrench American IndianFrench CanadianGermanGerman RussianGhanaianGreekGuamanian/ChamorroGuatemalanGuyaneseHaitianHmongHonduranHopiHoumaHungarianIcelanderIndian (Asian)IndonesianInupiatIranianIraqiIrishIroquoisIsraeliItalianJamaicanJapaneseJordanianKenyanKiowaKoreanLaotianLatvianLebaneseLiberianLithuanianLumbeeLuxembourgerMacedonianMalaysianMalteseMarshalleseMenomineeMexicanMexican American IndianMongolianMoroccanNative HawaiianNavajoNepaleseNew ZealanderNigerianNorthern EuropeanNorwegianOkinawanOsageOttawaPaiutePakistaniPalestinianPanamanianParaguayanPennsylvania GermanPeruvianPimaPolishPortuguesePotawatomiPuebloPuerto RicanPuget Sound SalishRomanianRussianSalvadoranSamoanScandinavianScotch-IrishScottishSeminoleSenegaleseSerbianShoshoneSierra LeoneanSiouxSlavicSlovakSloveneSomaliSouth AfricanSouth AmericanSouth American IndianSoviet UnionSpaniardSpanishSpanish AmericanSpanish American IndianSri LankanSubsaharan AfricanSudaneseSwedishSwissSyrianTaiwaneseThaiTlingit-HaidaTohono O'OdhamTonganTrinidadian and TobagonianTsimshianTurkishU.S. Virgin IslanderUgandanUkrainianUruguayanUteVenezuelanVietnameseWelshWest IndianYakamaYaquiYugoslavianYumanYup'ikZimbabwean
Immigration
NonimmigrantsImmigrantsAfghanistanAfricaAlbaniaArgentinaArmeniaAsiaAustraliaAustriaBahamasBangladeshBarbadosBelarusBelgiumBelizeBoliviaBosnia and HerzegovinaBrazilBulgariaBurma/MyanmarCabo VerdeCambodiaCameroonCanadaCaribbeanCentral AmericaChileChinaColombiaCongoCosta RicaCroatiaCubaCzechoslovakiaDenmarkDominicaDominican RepublicEastern AfricaEastern AsiaEastern EuropeEcuadorEgyptEl SalvadorEnglandEritreaEthiopiaEuropeFijiFranceGermanyGhanaGreeceGrenadaGuatemalaGuyanaHaitiHondurasHong KongHungaryIndiaIndonesiaIranIraqIrelandIsraelItalyJamaicaJapanJordanKazakhstanKenyaKoreaKuwaitLaosLatin AmericaLatviaLebanonLiberiaLithuaniaMalaysiaMexicoMicronesiaMiddle AfricaMoldovaMoroccoNepalNetherlandsNicaraguaNigeriaNorth AmericaNorth MacedoniaNorthern AfricaNorthern EuropeNorwayOceaniaPakistanPanamaPeruPhilippinesPolandPortugalRomaniaRussiaSaudi ArabiaScotlandSenegalSerbiaSierra LeoneSingaporeSomaliaSouth AfricaSouth AmericaSouth Central AsiaSouth Eastern AsiaSouthern EuropeSpainSri LankaSt. Vincent and the GrenadinesSudanSwedenSwitzerlandSyriaTaiwanThailandTrinidad and TobagoTurkeyUgandaUkraineUruguayUzbekistanVenezuelaVietnamWest IndiesWestern AfricaWestern AsiaWestern EuropeYemenZaireZimbabweAzores
4th Grade
Income
Poverty
Unemployment
Labor Participation
Family Structure
Vehicle Availability
Education Level
Disability

4th Grade Comparison

Nicaraguans

Immigrants from Italy

Tragic
Good
96.2%
4TH GRADE
0.0/ 100
METRIC RATING
315th/ 347
METRIC RANK
97.6%
4TH GRADE
63.7/ 100
METRIC RATING
159th/ 347
METRIC RANK

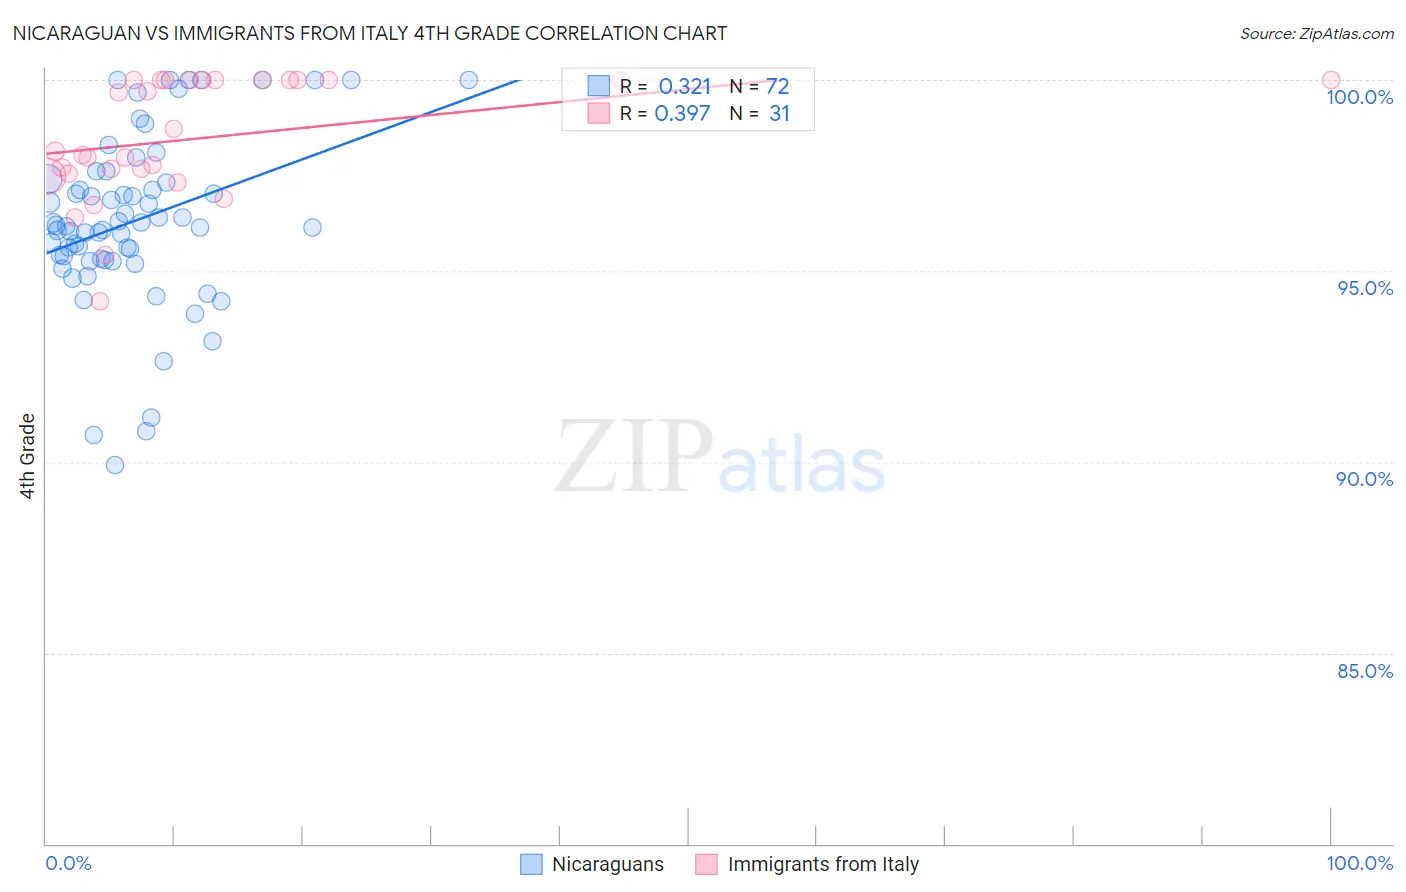
Nicaraguan vs Immigrants from Italy 4th Grade Correlation Chart

The statistical analysis conducted on geographies consisting of 285,711,389 people shows a mild positive correlation between the proportion of Nicaraguans and percentage of population with at least 4th grade education in the United States with a correlation coefficient (R) of 0.321 and weighted average of 96.2%. Similarly, the statistical analysis conducted on geographies consisting of 324,225,917 people shows a mild positive correlation between the proportion of Immigrants from Italy and percentage of population with at least 4th grade education in the United States with a correlation coefficient (R) of 0.397 and weighted average of 97.6%, a difference of 1.4%.
Nicaraguan vs Immigrants from Italy 4th Grade

4th Grade Correlation Summary

MeasurementNicaraguanImmigrants from Italy
Minimum89.9%94.2%
Maximum100.0%100.0%
Range10.1%5.8%
Mean96.3%98.5%
Median96.2%98.1%
Interquartile 25% (IQ1)95.3%97.5%
Interquartile 75% (IQ3)97.4%100.0%
Interquartile Range (IQR)2.0%2.5%
Standard Deviation (Sample)2.2%1.6%
Standard Deviation (Population)2.2%1.6%

Similar Demographics by 4th Grade

Demographics Similar to Nicaraguans by 4th Grade

In terms of 4th grade, the demographic groups most similar to Nicaraguans are Indonesian (96.2%, a difference of 0.010%), Vietnamese (96.2%, a difference of 0.010%), Immigrants from Ecuador (96.2%, a difference of 0.010%), Immigrants from Bangladesh (96.2%, a difference of 0.030%), and Cape Verdean (96.2%, a difference of 0.030%).
DemographicsRating | Rank4th Grade
Immigrants | Laos
0.0
/100
|
#308
Tragic
96.3%
Immigrants | Guyana
0.0
/100
|
#309
Tragic
96.3%
Immigrants | Burma/Myanmar
0.0
/100
|
#310
Tragic
96.3%
Immigrants | Bangladesh
0.0
/100
|
#311
Tragic
96.2%
Cape Verdeans
0.0
/100
|
#312
Tragic
96.2%
Indonesians
0.0
/100
|
#313
Tragic
96.2%
Vietnamese
0.0
/100
|
#314
Tragic
96.2%
Nicaraguans
0.0
/100
|
#315
Tragic
96.2%
Immigrants | Ecuador
0.0
/100
|
#316
Tragic
96.2%
Central American Indians
0.0
/100
|
#317
Tragic
96.2%
Immigrants | Azores
0.0
/100
|
#318
Tragic
96.1%
Belizeans
0.0
/100
|
#319
Tragic
96.1%
Bangladeshis
0.0
/100
|
#320
Tragic
96.1%
Japanese
0.0
/100
|
#321
Tragic
96.0%
Immigrants | Vietnam
0.0
/100
|
#322
Tragic
96.0%

Demographics Similar to Immigrants from Italy by 4th Grade

In terms of 4th grade, the demographic groups most similar to Immigrants from Italy are Immigrants from Russia (97.6%, a difference of 0.010%), Albanian (97.6%, a difference of 0.010%), Immigrants from Jordan (97.6%, a difference of 0.010%), Immigrants from Bosnia and Herzegovina (97.6%, a difference of 0.010%), and French American Indian (97.6%, a difference of 0.010%).
DemographicsRating | Rank4th Grade
Immigrants | South Central Asia
76.2
/100
|
#152
Good
97.6%
Immigrants | Eastern Europe
71.3
/100
|
#153
Good
97.6%
Immigrants | Russia
67.0
/100
|
#154
Good
97.6%
Albanians
67.0
/100
|
#155
Good
97.6%
Immigrants | Jordan
66.9
/100
|
#156
Good
97.6%
Immigrants | Bosnia and Herzegovina
66.0
/100
|
#157
Good
97.6%
French American Indians
65.9
/100
|
#158
Good
97.6%
Immigrants | Italy
63.7
/100
|
#159
Good
97.6%
Apache
61.3
/100
|
#160
Good
97.6%
Marshallese
60.8
/100
|
#161
Good
97.6%
Bermudans
60.5
/100
|
#162
Good
97.6%
Immigrants | Iran
60.3
/100
|
#163
Good
97.6%
Ugandans
58.9
/100
|
#164
Average
97.6%
Venezuelans
58.7
/100
|
#165
Average
97.6%
Kenyans
56.5
/100
|
#166
Average
97.5%