Nicaraguan vs Immigrants from Greece Kindergarten

COMPARE

Nicaraguan
Race
Ancestry
AfghanAfricanAlaska NativeAlaskan AthabascanAlbanianAleutAlsatianAmericanApacheArabArapahoArgentineanArmenianAssyrian/Chaldean/SyriacAustralianAustrianBahamianBangladeshiBarbadianBasqueBelgianBelizeanBermudanBhutaneseBlackfeetBolivianBrazilianBritishBritish West IndianBulgarianBurmeseCajunCambodianCanadianCape VerdeanCarpatho RusynCelticCentral AmericanCentral American IndianCherokeeCheyenneChickasawChileanChineseChippewaChoctawColombianColvilleComancheCosta RicanCreeCreekCroatianCrowCubanCypriotCzechCzechoslovakianDanishDelawareDominicanDutchDutch West IndianEastern EuropeanEcuadorianEgyptianEnglishEstonianEthiopianEuropeanFijianFilipinoFinnishFrenchFrench American IndianFrench CanadianGermanGerman RussianGhanaianGreekGuamanian/ChamorroGuatemalanGuyaneseHaitianHmongHonduranHopiHoumaHungarianIcelanderIndian (Asian)IndonesianInupiatIranianIraqiIrishIroquoisIsraeliItalianJamaicanJapaneseJordanianKenyanKiowaKoreanLaotianLatvianLebaneseLiberianLithuanianLumbeeLuxembourgerMacedonianMalaysianMalteseMarshalleseMenomineeMexicanMexican American IndianMongolianMoroccanNative HawaiianNavajoNepaleseNew ZealanderNicaraguanNigerianNorthern EuropeanNorwegianOkinawanOsageOttawaPaiutePakistaniPalestinianPanamanianParaguayanPennsylvania GermanPeruvianPimaPolishPortuguesePotawatomiPuebloPuerto RicanPuget Sound SalishRomanianRussianSalvadoranSamoanScandinavianScotch-IrishScottishSeminoleSenegaleseSerbianShoshoneSierra LeoneanSiouxSlavicSlovakSloveneSomaliSouth AfricanSouth AmericanSouth American IndianSoviet UnionSpaniardSpanishSpanish AmericanSpanish American IndianSri LankanSubsaharan AfricanSudaneseSwedishSwissSyrianTaiwaneseThaiTlingit-HaidaTohono O'OdhamTonganTrinidadian and TobagonianTsimshianTurkishU.S. Virgin IslanderUgandanUkrainianUruguayanUteVenezuelanVietnameseWelshWest IndianYakamaYaquiYugoslavianYumanYup'ikZimbabwean
Immigration
NonimmigrantsImmigrantsAfghanistanAfricaAlbaniaArgentinaArmeniaAsiaAustraliaAustriaBahamasBangladeshBarbadosBelarusBelgiumBelizeBoliviaBosnia and HerzegovinaBrazilBulgariaBurma/MyanmarCabo VerdeCambodiaCameroonCanadaCaribbeanCentral AmericaChileChinaColombiaCongoCosta RicaCroatiaCubaCzechoslovakiaDenmarkDominicaDominican RepublicEastern AfricaEastern AsiaEastern EuropeEcuadorEgyptEl SalvadorEnglandEritreaEthiopiaEuropeFijiFranceGermanyGhanaGrenadaGuatemalaGuyanaHaitiHondurasHong KongHungaryIndiaIndonesiaIranIraqIrelandIsraelItalyJamaicaJapanJordanKazakhstanKenyaKoreaKuwaitLaosLatin AmericaLatviaLebanonLiberiaLithuaniaMalaysiaMexicoMicronesiaMiddle AfricaMoldovaMoroccoNepalNetherlandsNicaraguaNigeriaNorth AmericaNorth MacedoniaNorthern AfricaNorthern EuropeNorwayOceaniaPakistanPanamaPeruPhilippinesPolandPortugalRomaniaRussiaSaudi ArabiaScotlandSenegalSerbiaSierra LeoneSingaporeSomaliaSouth AfricaSouth AmericaSouth Central AsiaSouth Eastern AsiaSouthern EuropeSpainSri LankaSt. Vincent and the GrenadinesSudanSwedenSwitzerlandSyriaTaiwanThailandTrinidad and TobagoTurkeyUgandaUkraineUruguayUzbekistanVenezuelaVietnamWest IndiesWestern AfricaWestern AsiaWestern EuropeYemenZaireZimbabweAzores
Immigrants from Greece
Race
Ancestry
AfghanAfricanAlaska NativeAlaskan AthabascanAlbanianAleutAlsatianAmericanApacheArabArapahoArgentineanArmenianAssyrian/Chaldean/SyriacAustralianAustrianBahamianBangladeshiBarbadianBasqueBelgianBelizeanBermudanBhutaneseBlackfeetBolivianBrazilianBritishBritish West IndianBulgarianBurmeseCajunCambodianCanadianCape VerdeanCarpatho RusynCelticCentral AmericanCentral American IndianCherokeeCheyenneChickasawChileanChineseChippewaChoctawColombianColvilleComancheCosta RicanCreeCreekCroatianCrowCubanCypriotCzechCzechoslovakianDanishDelawareDominicanDutchDutch West IndianEastern EuropeanEcuadorianEgyptianEnglishEstonianEthiopianEuropeanFijianFilipinoFinnishFrenchFrench American IndianFrench CanadianGermanGerman RussianGhanaianGreekGuamanian/ChamorroGuatemalanGuyaneseHaitianHmongHonduranHopiHoumaHungarianIcelanderIndian (Asian)IndonesianInupiatIranianIraqiIrishIroquoisIsraeliItalianJamaicanJapaneseJordanianKenyanKiowaKoreanLaotianLatvianLebaneseLiberianLithuanianLumbeeLuxembourgerMacedonianMalaysianMalteseMarshalleseMenomineeMexicanMexican American IndianMongolianMoroccanNative HawaiianNavajoNepaleseNew ZealanderNigerianNorthern EuropeanNorwegianOkinawanOsageOttawaPaiutePakistaniPalestinianPanamanianParaguayanPennsylvania GermanPeruvianPimaPolishPortuguesePotawatomiPuebloPuerto RicanPuget Sound SalishRomanianRussianSalvadoranSamoanScandinavianScotch-IrishScottishSeminoleSenegaleseSerbianShoshoneSierra LeoneanSiouxSlavicSlovakSloveneSomaliSouth AfricanSouth AmericanSouth American IndianSoviet UnionSpaniardSpanishSpanish AmericanSpanish American IndianSri LankanSubsaharan AfricanSudaneseSwedishSwissSyrianTaiwaneseThaiTlingit-HaidaTohono O'OdhamTonganTrinidadian and TobagonianTsimshianTurkishU.S. Virgin IslanderUgandanUkrainianUruguayanUteVenezuelanVietnameseWelshWest IndianYakamaYaquiYugoslavianYumanYup'ikZimbabwean
Immigration
NonimmigrantsImmigrantsAfghanistanAfricaAlbaniaArgentinaArmeniaAsiaAustraliaAustriaBahamasBangladeshBarbadosBelarusBelgiumBelizeBoliviaBosnia and HerzegovinaBrazilBulgariaBurma/MyanmarCabo VerdeCambodiaCameroonCanadaCaribbeanCentral AmericaChileChinaColombiaCongoCosta RicaCroatiaCubaCzechoslovakiaDenmarkDominicaDominican RepublicEastern AfricaEastern AsiaEastern EuropeEcuadorEgyptEl SalvadorEnglandEritreaEthiopiaEuropeFijiFranceGermanyGhanaGreeceGrenadaGuatemalaGuyanaHaitiHondurasHong KongHungaryIndiaIndonesiaIranIraqIrelandIsraelItalyJamaicaJapanJordanKazakhstanKenyaKoreaKuwaitLaosLatin AmericaLatviaLebanonLiberiaLithuaniaMalaysiaMexicoMicronesiaMiddle AfricaMoldovaMoroccoNepalNetherlandsNicaraguaNigeriaNorth AmericaNorth MacedoniaNorthern AfricaNorthern EuropeNorwayOceaniaPakistanPanamaPeruPhilippinesPolandPortugalRomaniaRussiaSaudi ArabiaScotlandSenegalSerbiaSierra LeoneSingaporeSomaliaSouth AfricaSouth AmericaSouth Central AsiaSouth Eastern AsiaSouthern EuropeSpainSri LankaSt. Vincent and the GrenadinesSudanSwedenSwitzerlandSyriaTaiwanThailandTrinidad and TobagoTurkeyUgandaUkraineUruguayUzbekistanVenezuelaVietnamWest IndiesWestern AfricaWestern AsiaWestern EuropeYemenZaireZimbabweAzores
Kindergarten
Income
Poverty
Unemployment
Labor Participation
Family Structure
Vehicle Availability
Education Level
Disability

Kindergarten Comparison

Nicaraguans

Immigrants from Greece

Tragic
Good
97.0%
KINDERGARTEN
0.0/ 100
METRIC RATING
304th/ 347
METRIC RANK
98.0%
KINDERGARTEN
74.9/ 100
METRIC RATING
149th/ 347
METRIC RANK

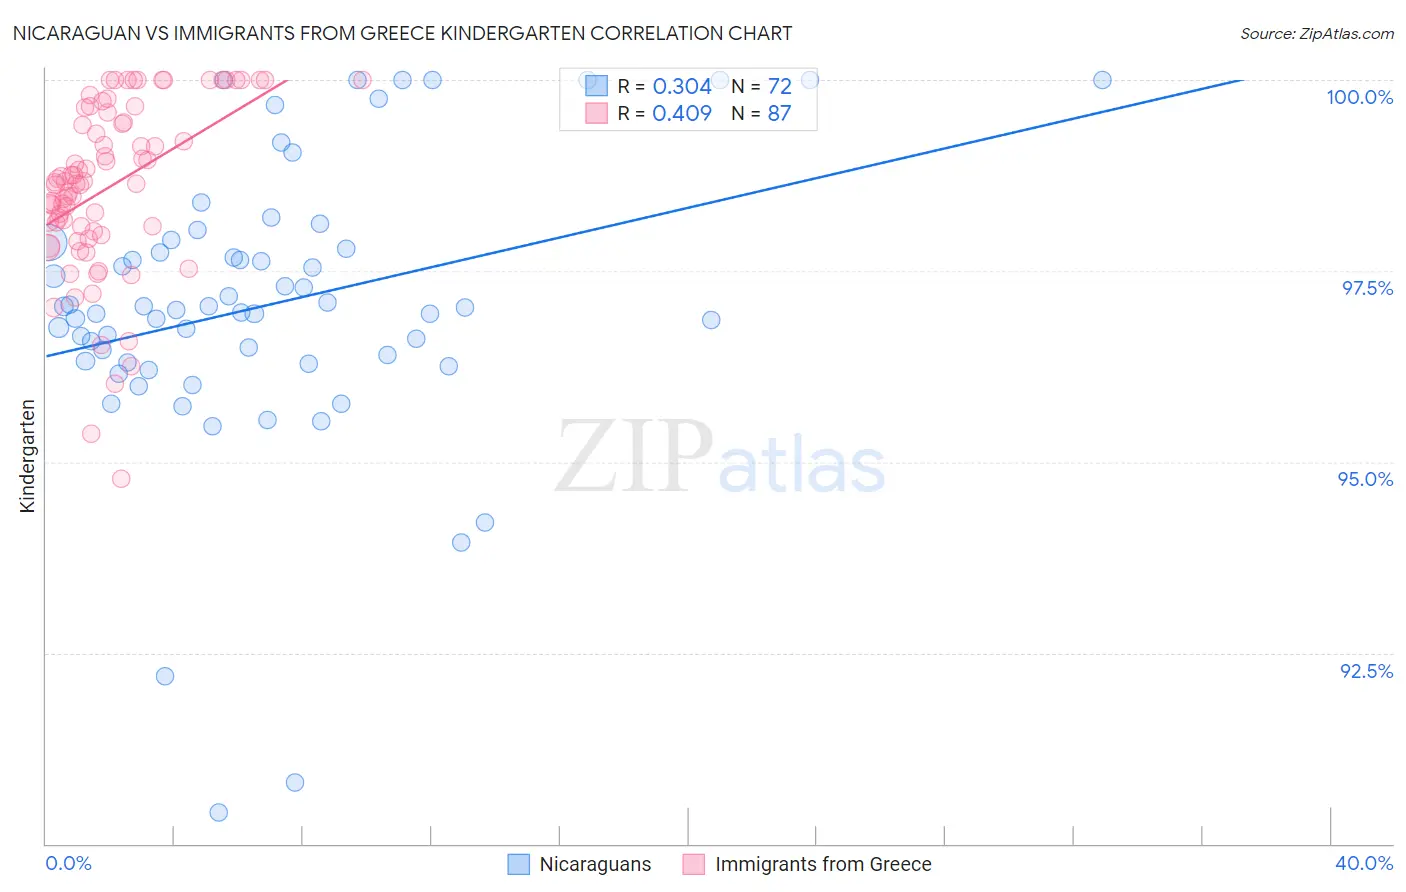
Nicaraguan vs Immigrants from Greece Kindergarten Correlation Chart

The statistical analysis conducted on geographies consisting of 285,711,389 people shows a mild positive correlation between the proportion of Nicaraguans and percentage of population with at least kindergarten education in the United States with a correlation coefficient (R) of 0.304 and weighted average of 97.0%. Similarly, the statistical analysis conducted on geographies consisting of 216,879,847 people shows a moderate positive correlation between the proportion of Immigrants from Greece and percentage of population with at least kindergarten education in the United States with a correlation coefficient (R) of 0.409 and weighted average of 98.0%, a difference of 1.0%.
Nicaraguan vs Immigrants from Greece Kindergarten

Kindergarten Correlation Summary

MeasurementNicaraguanImmigrants from Greece
Minimum90.4%94.8%
Maximum100.0%100.0%
Range9.6%5.2%
Mean97.1%98.6%
Median97.0%98.7%
Interquartile 25% (IQ1)96.3%98.0%
Interquartile 75% (IQ3)97.8%99.6%
Interquartile Range (IQR)1.5%1.5%
Standard Deviation (Sample)1.9%1.1%
Standard Deviation (Population)1.9%1.1%

Similar Demographics by Kindergarten

Demographics Similar to Nicaraguans by Kindergarten

In terms of kindergarten, the demographic groups most similar to Nicaraguans are Somali (97.0%, a difference of 0.0%), Ecuadorian (97.0%, a difference of 0.0%), Immigrants from Caribbean (97.1%, a difference of 0.040%), Belizean (97.0%, a difference of 0.050%), and Hispanic or Latino (97.0%, a difference of 0.060%).
DemographicsRating | RankKindergarten
Central American Indians
0.0
/100
|
#297
Tragic
97.2%
Immigrants | Dominica
0.0
/100
|
#298
Tragic
97.1%
Immigrants | Cuba
0.0
/100
|
#299
Tragic
97.1%
Haitians
0.0
/100
|
#300
Tragic
97.1%
Immigrants | South Eastern Asia
0.0
/100
|
#301
Tragic
97.1%
Immigrants | Caribbean
0.0
/100
|
#302
Tragic
97.1%
Somalis
0.0
/100
|
#303
Tragic
97.0%
Nicaraguans
0.0
/100
|
#304
Tragic
97.0%
Ecuadorians
0.0
/100
|
#305
Tragic
97.0%
Belizeans
0.0
/100
|
#306
Tragic
97.0%
Hispanics or Latinos
0.0
/100
|
#307
Tragic
97.0%
Immigrants | Somalia
0.0
/100
|
#308
Tragic
97.0%
Immigrants | Haiti
0.0
/100
|
#309
Tragic
97.0%
Immigrants | Azores
0.0
/100
|
#310
Tragic
97.0%
Sri Lankans
0.0
/100
|
#311
Tragic
97.0%

Demographics Similar to Immigrants from Greece by Kindergarten

In terms of kindergarten, the demographic groups most similar to Immigrants from Greece are Apache (98.0%, a difference of 0.0%), Filipino (98.0%, a difference of 0.010%), Immigrants from Israel (98.0%, a difference of 0.010%), Jordanian (98.0%, a difference of 0.010%), and Alsatian (98.1%, a difference of 0.020%).
DemographicsRating | RankKindergarten
Immigrants | Turkey
82.8
/100
|
#142
Excellent
98.1%
Burmese
81.5
/100
|
#143
Excellent
98.1%
Alsatians
80.4
/100
|
#144
Excellent
98.1%
Hmong
78.8
/100
|
#145
Good
98.1%
Filipinos
78.3
/100
|
#146
Good
98.0%
Immigrants | Israel
77.6
/100
|
#147
Good
98.0%
Apache
75.0
/100
|
#148
Good
98.0%
Immigrants | Greece
74.9
/100
|
#149
Good
98.0%
Jordanians
72.8
/100
|
#150
Good
98.0%
Soviet Union
70.8
/100
|
#151
Good
98.0%
Dutch West Indians
70.1
/100
|
#152
Good
98.0%
Immigrants | Moldova
69.1
/100
|
#153
Good
98.0%
Immigrants | Iran
68.8
/100
|
#154
Good
98.0%
Comanche
68.3
/100
|
#155
Good
98.0%
Immigrants | South Central Asia
66.6
/100
|
#156
Good
98.0%