Nicaraguan vs Immigrants from Belarus 5th Grade

COMPARE

Nicaraguan
Race
Ancestry
AfghanAfricanAlaska NativeAlaskan AthabascanAlbanianAleutAlsatianAmericanApacheArabArapahoArgentineanArmenianAssyrian/Chaldean/SyriacAustralianAustrianBahamianBangladeshiBarbadianBasqueBelgianBelizeanBermudanBhutaneseBlackfeetBolivianBrazilianBritishBritish West IndianBulgarianBurmeseCajunCambodianCanadianCape VerdeanCarpatho RusynCelticCentral AmericanCentral American IndianCherokeeCheyenneChickasawChileanChineseChippewaChoctawColombianColvilleComancheCosta RicanCreeCreekCroatianCrowCubanCypriotCzechCzechoslovakianDanishDelawareDominicanDutchDutch West IndianEastern EuropeanEcuadorianEgyptianEnglishEstonianEthiopianEuropeanFijianFilipinoFinnishFrenchFrench American IndianFrench CanadianGermanGerman RussianGhanaianGreekGuamanian/ChamorroGuatemalanGuyaneseHaitianHmongHonduranHopiHoumaHungarianIcelanderIndian (Asian)IndonesianInupiatIranianIraqiIrishIroquoisIsraeliItalianJamaicanJapaneseJordanianKenyanKiowaKoreanLaotianLatvianLebaneseLiberianLithuanianLumbeeLuxembourgerMacedonianMalaysianMalteseMarshalleseMenomineeMexicanMexican American IndianMongolianMoroccanNative HawaiianNavajoNepaleseNew ZealanderNicaraguanNigerianNorthern EuropeanNorwegianOkinawanOsageOttawaPaiutePakistaniPalestinianPanamanianParaguayanPennsylvania GermanPeruvianPimaPolishPortuguesePotawatomiPuebloPuerto RicanPuget Sound SalishRomanianRussianSalvadoranSamoanScandinavianScotch-IrishScottishSeminoleSenegaleseSerbianShoshoneSierra LeoneanSiouxSlavicSlovakSloveneSomaliSouth AfricanSouth AmericanSouth American IndianSoviet UnionSpaniardSpanishSpanish AmericanSpanish American IndianSri LankanSubsaharan AfricanSudaneseSwedishSwissSyrianTaiwaneseThaiTlingit-HaidaTohono O'OdhamTonganTrinidadian and TobagonianTsimshianTurkishU.S. Virgin IslanderUgandanUkrainianUruguayanUteVenezuelanVietnameseWelshWest IndianYakamaYaquiYugoslavianYumanYup'ikZimbabwean
Immigration
NonimmigrantsImmigrantsAfghanistanAfricaAlbaniaArgentinaArmeniaAsiaAustraliaAustriaBahamasBangladeshBarbadosBelgiumBelizeBoliviaBosnia and HerzegovinaBrazilBulgariaBurma/MyanmarCabo VerdeCambodiaCameroonCanadaCaribbeanCentral AmericaChileChinaColombiaCongoCosta RicaCroatiaCubaCzechoslovakiaDenmarkDominicaDominican RepublicEastern AfricaEastern AsiaEastern EuropeEcuadorEgyptEl SalvadorEnglandEritreaEthiopiaEuropeFijiFranceGermanyGhanaGreeceGrenadaGuatemalaGuyanaHaitiHondurasHong KongHungaryIndiaIndonesiaIranIraqIrelandIsraelItalyJamaicaJapanJordanKazakhstanKenyaKoreaKuwaitLaosLatin AmericaLatviaLebanonLiberiaLithuaniaMalaysiaMexicoMicronesiaMiddle AfricaMoldovaMoroccoNepalNetherlandsNicaraguaNigeriaNorth AmericaNorth MacedoniaNorthern AfricaNorthern EuropeNorwayOceaniaPakistanPanamaPeruPhilippinesPolandPortugalRomaniaRussiaSaudi ArabiaScotlandSenegalSerbiaSierra LeoneSingaporeSomaliaSouth AfricaSouth AmericaSouth Central AsiaSouth Eastern AsiaSouthern EuropeSpainSri LankaSt. Vincent and the GrenadinesSudanSwedenSwitzerlandSyriaTaiwanThailandTrinidad and TobagoTurkeyUgandaUkraineUruguayUzbekistanVenezuelaVietnamWest IndiesWestern AfricaWestern AsiaWestern EuropeYemenZaireZimbabweAzores
Immigrants from Belarus
Race
Ancestry
AfghanAfricanAlaska NativeAlaskan AthabascanAlbanianAleutAlsatianAmericanApacheArabArapahoArgentineanArmenianAssyrian/Chaldean/SyriacAustralianAustrianBahamianBangladeshiBarbadianBasqueBelgianBelizeanBermudanBhutaneseBlackfeetBolivianBrazilianBritishBritish West IndianBulgarianBurmeseCajunCambodianCanadianCape VerdeanCarpatho RusynCelticCentral AmericanCentral American IndianCherokeeCheyenneChickasawChileanChineseChippewaChoctawColombianColvilleComancheCosta RicanCreeCreekCroatianCrowCubanCypriotCzechCzechoslovakianDanishDelawareDominicanDutchDutch West IndianEastern EuropeanEcuadorianEgyptianEnglishEstonianEthiopianEuropeanFijianFilipinoFinnishFrenchFrench American IndianFrench CanadianGermanGerman RussianGhanaianGreekGuamanian/ChamorroGuatemalanGuyaneseHaitianHmongHonduranHopiHoumaHungarianIcelanderIndian (Asian)IndonesianInupiatIranianIraqiIrishIroquoisIsraeliItalianJamaicanJapaneseJordanianKenyanKiowaKoreanLaotianLatvianLebaneseLiberianLithuanianLumbeeLuxembourgerMacedonianMalaysianMalteseMarshalleseMenomineeMexicanMexican American IndianMongolianMoroccanNative HawaiianNavajoNepaleseNew ZealanderNigerianNorthern EuropeanNorwegianOkinawanOsageOttawaPaiutePakistaniPalestinianPanamanianParaguayanPennsylvania GermanPeruvianPimaPolishPortuguesePotawatomiPuebloPuerto RicanPuget Sound SalishRomanianRussianSalvadoranSamoanScandinavianScotch-IrishScottishSeminoleSenegaleseSerbianShoshoneSierra LeoneanSiouxSlavicSlovakSloveneSomaliSouth AfricanSouth AmericanSouth American IndianSoviet UnionSpaniardSpanishSpanish AmericanSpanish American IndianSri LankanSubsaharan AfricanSudaneseSwedishSwissSyrianTaiwaneseThaiTlingit-HaidaTohono O'OdhamTonganTrinidadian and TobagonianTsimshianTurkishU.S. Virgin IslanderUgandanUkrainianUruguayanUteVenezuelanVietnameseWelshWest IndianYakamaYaquiYugoslavianYumanYup'ikZimbabwean
Immigration
NonimmigrantsImmigrantsAfghanistanAfricaAlbaniaArgentinaArmeniaAsiaAustraliaAustriaBahamasBangladeshBarbadosBelarusBelgiumBelizeBoliviaBosnia and HerzegovinaBrazilBulgariaBurma/MyanmarCabo VerdeCambodiaCameroonCanadaCaribbeanCentral AmericaChileChinaColombiaCongoCosta RicaCroatiaCubaCzechoslovakiaDenmarkDominicaDominican RepublicEastern AfricaEastern AsiaEastern EuropeEcuadorEgyptEl SalvadorEnglandEritreaEthiopiaEuropeFijiFranceGermanyGhanaGreeceGrenadaGuatemalaGuyanaHaitiHondurasHong KongHungaryIndiaIndonesiaIranIraqIrelandIsraelItalyJamaicaJapanJordanKazakhstanKenyaKoreaKuwaitLaosLatin AmericaLatviaLebanonLiberiaLithuaniaMalaysiaMexicoMicronesiaMiddle AfricaMoldovaMoroccoNepalNetherlandsNicaraguaNigeriaNorth AmericaNorth MacedoniaNorthern AfricaNorthern EuropeNorwayOceaniaPakistanPanamaPeruPhilippinesPolandPortugalRomaniaRussiaSaudi ArabiaScotlandSenegalSerbiaSierra LeoneSingaporeSomaliaSouth AfricaSouth AmericaSouth Central AsiaSouth Eastern AsiaSouthern EuropeSpainSri LankaSt. Vincent and the GrenadinesSudanSwedenSwitzerlandSyriaTaiwanThailandTrinidad and TobagoTurkeyUgandaUkraineUruguayUzbekistanVenezuelaVietnamWest IndiesWestern AfricaWestern AsiaWestern EuropeYemenZaireZimbabweAzores
5th Grade
Income
Poverty
Unemployment
Labor Participation
Family Structure
Vehicle Availability
Education Level
Disability

5th Grade Comparison

Nicaraguans

Immigrants from Belarus

Tragic
Average
95.9%
5TH GRADE
0.0/ 100
METRIC RATING
315th/ 347
METRIC RANK
97.3%
5TH GRADE
54.6/ 100
METRIC RATING
167th/ 347
METRIC RANK

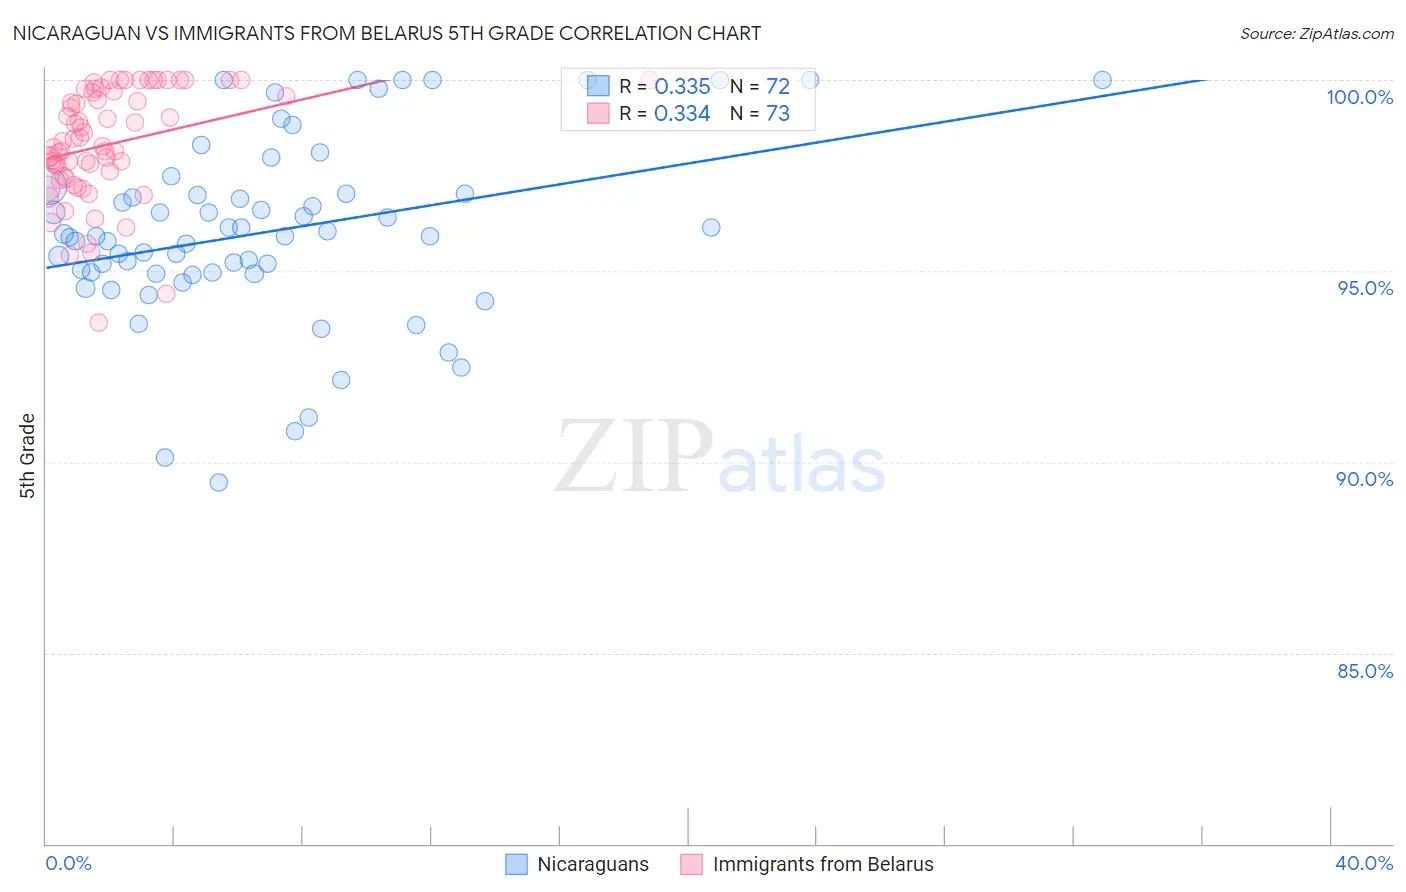
Nicaraguan vs Immigrants from Belarus 5th Grade Correlation Chart

The statistical analysis conducted on geographies consisting of 285,711,389 people shows a mild positive correlation between the proportion of Nicaraguans and percentage of population with at least 5th grade education in the United States with a correlation coefficient (R) of 0.335 and weighted average of 95.9%. Similarly, the statistical analysis conducted on geographies consisting of 150,073,430 people shows a mild positive correlation between the proportion of Immigrants from Belarus and percentage of population with at least 5th grade education in the United States with a correlation coefficient (R) of 0.334 and weighted average of 97.3%, a difference of 1.5%.
Nicaraguan vs Immigrants from Belarus 5th Grade

5th Grade Correlation Summary

MeasurementNicaraguanImmigrants from Belarus
Minimum89.5%93.6%
Maximum100.0%100.0%
Range10.5%6.4%
Mean96.0%98.3%
Median95.9%98.3%
Interquartile 25% (IQ1)94.9%97.4%
Interquartile 75% (IQ3)97.0%99.7%
Interquartile Range (IQR)2.1%2.3%
Standard Deviation (Sample)2.4%1.5%
Standard Deviation (Population)2.4%1.4%

Similar Demographics by 5th Grade

Demographics Similar to Nicaraguans by 5th Grade

In terms of 5th grade, the demographic groups most similar to Nicaraguans are Bangladeshi (95.9%, a difference of 0.020%), Immigrants from Portugal (95.9%, a difference of 0.020%), Vietnamese (95.9%, a difference of 0.040%), Immigrants from Ecuador (95.8%, a difference of 0.060%), and Immigrants from Bangladesh (96.0%, a difference of 0.070%).
DemographicsRating | Rank5th Grade
Ecuadorians
0.0
/100
|
#308
Tragic
96.0%
Immigrants | Guyana
0.0
/100
|
#309
Tragic
96.0%
Indonesians
0.0
/100
|
#310
Tragic
96.0%
Immigrants | Bangladesh
0.0
/100
|
#311
Tragic
96.0%
Vietnamese
0.0
/100
|
#312
Tragic
95.9%
Bangladeshis
0.0
/100
|
#313
Tragic
95.9%
Immigrants | Portugal
0.0
/100
|
#314
Tragic
95.9%
Nicaraguans
0.0
/100
|
#315
Tragic
95.9%
Immigrants | Ecuador
0.0
/100
|
#316
Tragic
95.8%
Belizeans
0.0
/100
|
#317
Tragic
95.8%
Immigrants | Vietnam
0.0
/100
|
#318
Tragic
95.8%
Japanese
0.0
/100
|
#319
Tragic
95.7%
Central American Indians
0.0
/100
|
#320
Tragic
95.7%
Immigrants | Belize
0.0
/100
|
#321
Tragic
95.7%
Immigrants | Nicaragua
0.0
/100
|
#322
Tragic
95.6%

Demographics Similar to Immigrants from Belarus by 5th Grade

In terms of 5th grade, the demographic groups most similar to Immigrants from Belarus are Chilean (97.3%, a difference of 0.0%), Immigrants from Korea (97.3%, a difference of 0.0%), Venezuelan (97.3%, a difference of 0.0%), Immigrants from Sri Lanka (97.3%, a difference of 0.0%), and Arab (97.3%, a difference of 0.0%).
DemographicsRating | Rank5th Grade
Marshallese
61.2
/100
|
#160
Good
97.4%
Kenyans
59.7
/100
|
#161
Average
97.4%
Immigrants | Iran
59.5
/100
|
#162
Average
97.4%
Ugandans
58.9
/100
|
#163
Average
97.4%
Bermudans
58.8
/100
|
#164
Average
97.4%
Immigrants | Poland
57.9
/100
|
#165
Average
97.4%
Apache
57.2
/100
|
#166
Average
97.4%
Immigrants | Belarus
54.6
/100
|
#167
Average
97.3%
Chileans
54.5
/100
|
#168
Average
97.3%
Immigrants | Korea
54.1
/100
|
#169
Average
97.3%
Venezuelans
54.0
/100
|
#170
Average
97.3%
Immigrants | Sri Lanka
53.8
/100
|
#171
Average
97.3%
Arabs
53.4
/100
|
#172
Average
97.3%
Egyptians
52.4
/100
|
#173
Average
97.3%
Immigrants | Kazakhstan
50.0
/100
|
#174
Average
97.3%