Nepalese vs South American 9th Grade

COMPARE

Nepalese
Race
Ancestry
AfghanAfricanAlaska NativeAlaskan AthabascanAlbanianAleutAlsatianAmericanApacheArabArapahoArgentineanArmenianAssyrian/Chaldean/SyriacAustralianAustrianBahamianBangladeshiBarbadianBasqueBelgianBelizeanBermudanBhutaneseBlackfeetBolivianBrazilianBritishBritish West IndianBulgarianBurmeseCajunCambodianCanadianCape VerdeanCarpatho RusynCelticCentral AmericanCentral American IndianCherokeeCheyenneChickasawChileanChineseChippewaChoctawColombianColvilleComancheCosta RicanCreeCreekCroatianCrowCubanCypriotCzechCzechoslovakianDanishDelawareDominicanDutchDutch West IndianEastern EuropeanEcuadorianEgyptianEnglishEstonianEthiopianEuropeanFijianFilipinoFinnishFrenchFrench American IndianFrench CanadianGermanGerman RussianGhanaianGreekGuamanian/ChamorroGuatemalanGuyaneseHaitianHmongHonduranHopiHoumaHungarianIcelanderIndian (Asian)IndonesianInupiatIranianIraqiIrishIroquoisIsraeliItalianJamaicanJapaneseJordanianKenyanKiowaKoreanLaotianLatvianLebaneseLiberianLithuanianLumbeeLuxembourgerMacedonianMalaysianMalteseMarshalleseMenomineeMexicanMexican American IndianMongolianMoroccanNative HawaiianNavajoNepaleseNew ZealanderNicaraguanNigerianNorthern EuropeanNorwegianOkinawanOsageOttawaPaiutePakistaniPalestinianPanamanianParaguayanPennsylvania GermanPeruvianPimaPolishPortuguesePotawatomiPuebloPuerto RicanPuget Sound SalishRomanianRussianSalvadoranSamoanScandinavianScotch-IrishScottishSeminoleSenegaleseSerbianShoshoneSierra LeoneanSiouxSlavicSlovakSloveneSomaliSouth AfricanSouth American IndianSoviet UnionSpaniardSpanishSpanish AmericanSpanish American IndianSri LankanSubsaharan AfricanSudaneseSwedishSwissSyrianTaiwaneseThaiTlingit-HaidaTohono O'OdhamTonganTrinidadian and TobagonianTsimshianTurkishU.S. Virgin IslanderUgandanUkrainianUruguayanUteVenezuelanVietnameseWelshWest IndianYakamaYaquiYugoslavianYumanYup'ikZimbabwean
Immigration
NonimmigrantsImmigrantsAfghanistanAfricaAlbaniaArgentinaArmeniaAsiaAustraliaAustriaBahamasBangladeshBarbadosBelarusBelgiumBelizeBoliviaBosnia and HerzegovinaBrazilBulgariaBurma/MyanmarCabo VerdeCambodiaCameroonCanadaCaribbeanCentral AmericaChileChinaColombiaCongoCosta RicaCroatiaCubaCzechoslovakiaDenmarkDominicaDominican RepublicEastern AfricaEastern AsiaEastern EuropeEcuadorEgyptEl SalvadorEnglandEritreaEthiopiaEuropeFijiFranceGermanyGhanaGreeceGrenadaGuatemalaGuyanaHaitiHondurasHong KongHungaryIndiaIndonesiaIranIraqIrelandIsraelItalyJamaicaJapanJordanKazakhstanKenyaKoreaKuwaitLaosLatin AmericaLatviaLebanonLiberiaLithuaniaMalaysiaMexicoMicronesiaMiddle AfricaMoldovaMoroccoNepalNetherlandsNicaraguaNigeriaNorth AmericaNorth MacedoniaNorthern AfricaNorthern EuropeNorwayOceaniaPakistanPanamaPeruPhilippinesPolandPortugalRomaniaRussiaSaudi ArabiaScotlandSenegalSerbiaSierra LeoneSingaporeSomaliaSouth AfricaSouth AmericaSouth Central AsiaSouth Eastern AsiaSouthern EuropeSpainSri LankaSt. Vincent and the GrenadinesSudanSwedenSwitzerlandSyriaTaiwanThailandTrinidad and TobagoTurkeyUgandaUkraineUruguayUzbekistanVenezuelaVietnamWest IndiesWestern AfricaWestern AsiaWestern EuropeYemenZaireZimbabweAzores
South American
Race
Ancestry
AfghanAfricanAlaska NativeAlaskan AthabascanAlbanianAleutAlsatianAmericanApacheArabArapahoArgentineanArmenianAssyrian/Chaldean/SyriacAustralianAustrianBahamianBangladeshiBarbadianBasqueBelgianBelizeanBermudanBhutaneseBlackfeetBolivianBrazilianBritishBritish West IndianBulgarianBurmeseCajunCambodianCanadianCape VerdeanCarpatho RusynCelticCentral AmericanCentral American IndianCherokeeCheyenneChickasawChileanChineseChippewaChoctawColombianColvilleComancheCosta RicanCreeCreekCroatianCrowCubanCypriotCzechCzechoslovakianDanishDelawareDominicanDutchDutch West IndianEastern EuropeanEcuadorianEgyptianEnglishEstonianEthiopianEuropeanFijianFilipinoFinnishFrenchFrench American IndianFrench CanadianGermanGerman RussianGhanaianGreekGuamanian/ChamorroGuatemalanGuyaneseHaitianHmongHonduranHopiHoumaHungarianIcelanderIndian (Asian)IndonesianInupiatIranianIraqiIrishIroquoisIsraeliItalianJamaicanJapaneseJordanianKenyanKiowaKoreanLaotianLatvianLebaneseLiberianLithuanianLumbeeLuxembourgerMacedonianMalaysianMalteseMarshalleseMenomineeMexicanMexican American IndianMongolianMoroccanNative HawaiianNavajoNew ZealanderNicaraguanNigerianNorthern EuropeanNorwegianOkinawanOsageOttawaPaiutePakistaniPalestinianPanamanianParaguayanPennsylvania GermanPeruvianPimaPolishPortuguesePotawatomiPuebloPuerto RicanPuget Sound SalishRomanianRussianSalvadoranSamoanScandinavianScotch-IrishScottishSeminoleSenegaleseSerbianShoshoneSierra LeoneanSiouxSlavicSlovakSloveneSomaliSouth AfricanSouth AmericanSouth American IndianSoviet UnionSpaniardSpanishSpanish AmericanSpanish American IndianSri LankanSubsaharan AfricanSudaneseSwedishSwissSyrianTaiwaneseThaiTlingit-HaidaTohono O'OdhamTonganTrinidadian and TobagonianTsimshianTurkishU.S. Virgin IslanderUgandanUkrainianUruguayanUteVenezuelanVietnameseWelshWest IndianYakamaYaquiYugoslavianYumanYup'ikZimbabwean
Immigration
NonimmigrantsImmigrantsAfghanistanAfricaAlbaniaArgentinaArmeniaAsiaAustraliaAustriaBahamasBangladeshBarbadosBelarusBelgiumBelizeBoliviaBosnia and HerzegovinaBrazilBulgariaBurma/MyanmarCabo VerdeCambodiaCameroonCanadaCaribbeanCentral AmericaChileChinaColombiaCongoCosta RicaCroatiaCubaCzechoslovakiaDenmarkDominicaDominican RepublicEastern AfricaEastern AsiaEastern EuropeEcuadorEgyptEl SalvadorEnglandEritreaEthiopiaEuropeFijiFranceGermanyGhanaGreeceGrenadaGuatemalaGuyanaHaitiHondurasHong KongHungaryIndiaIndonesiaIranIraqIrelandIsraelItalyJamaicaJapanJordanKazakhstanKenyaKoreaKuwaitLaosLatin AmericaLatviaLebanonLiberiaLithuaniaMalaysiaMexicoMicronesiaMiddle AfricaMoldovaMoroccoNepalNetherlandsNicaraguaNigeriaNorth AmericaNorth MacedoniaNorthern AfricaNorthern EuropeNorwayOceaniaPakistanPanamaPeruPhilippinesPolandPortugalRomaniaRussiaSaudi ArabiaScotlandSenegalSerbiaSierra LeoneSingaporeSomaliaSouth AfricaSouth AmericaSouth Central AsiaSouth Eastern AsiaSouthern EuropeSpainSri LankaSt. Vincent and the GrenadinesSudanSwedenSwitzerlandSyriaTaiwanThailandTrinidad and TobagoTurkeyUgandaUkraineUruguayUzbekistanVenezuelaVietnamWest IndiesWestern AfricaWestern AsiaWestern EuropeYemenZaireZimbabweAzores
9th Grade
Income
Poverty
Unemployment
Labor Participation
Family Structure
Vehicle Availability
Education Level
Disability

9th Grade Comparison

Nepalese

South Americans

Tragic
Tragic
92.0%
9TH GRADE
0.0/ 100
METRIC RATING
318th/ 347
METRIC RANK
93.9%
9TH GRADE
0.4/ 100
METRIC RATING
261st/ 347
METRIC RANK

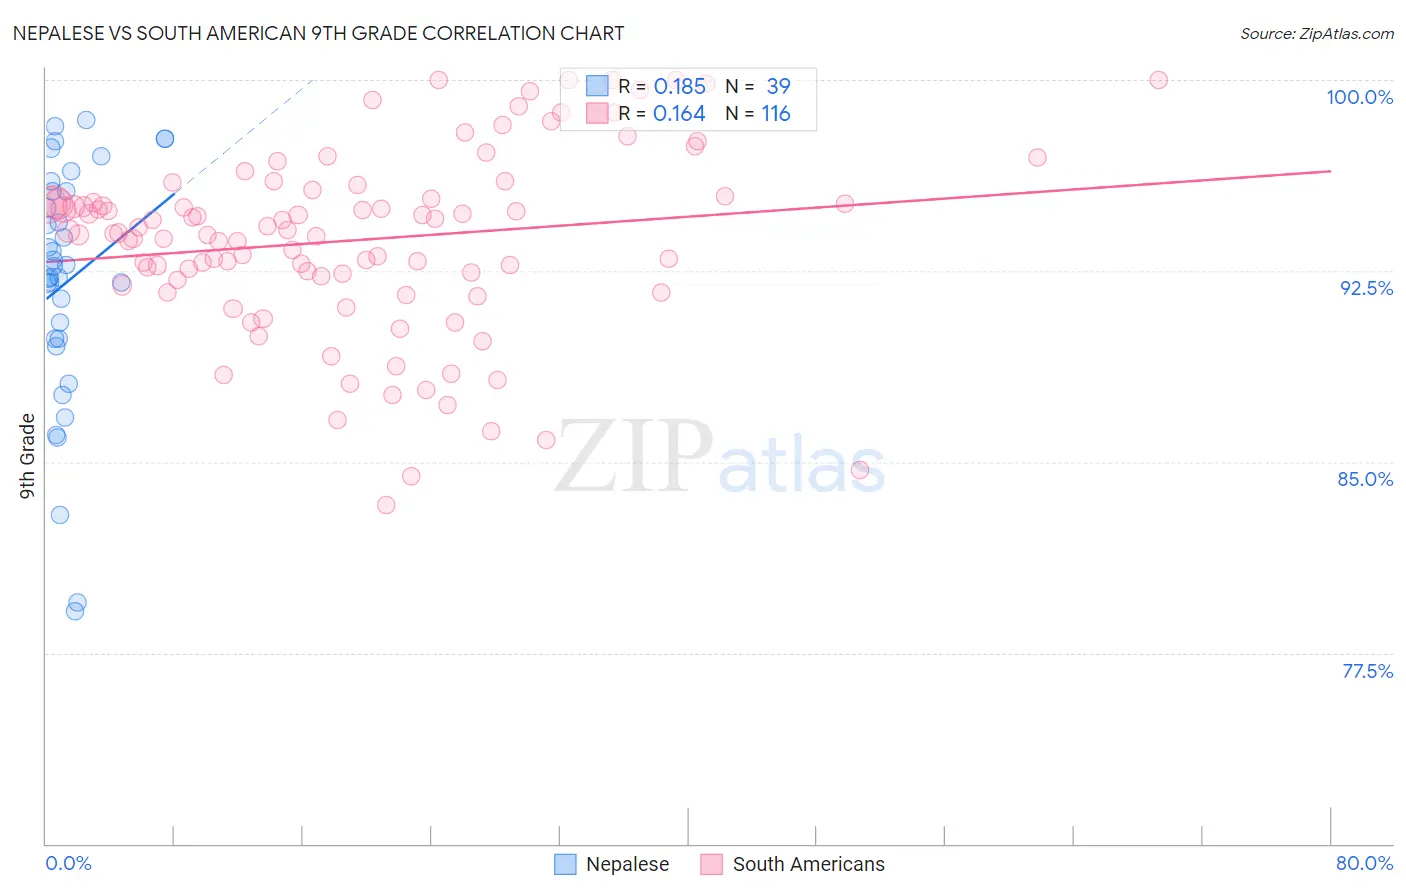
Nepalese vs South American 9th Grade Correlation Chart

The statistical analysis conducted on geographies consisting of 24,519,269 people shows a poor positive correlation between the proportion of Nepalese and percentage of population with at least 9th grade education in the United States with a correlation coefficient (R) of 0.185 and weighted average of 92.0%. Similarly, the statistical analysis conducted on geographies consisting of 494,065,697 people shows a poor positive correlation between the proportion of South Americans and percentage of population with at least 9th grade education in the United States with a correlation coefficient (R) of 0.164 and weighted average of 93.9%, a difference of 2.1%.
Nepalese vs South American 9th Grade

9th Grade Correlation Summary

MeasurementNepaleseSouth American
Minimum79.1%83.3%
Maximum98.4%100.0%
Range19.3%16.7%
Mean92.1%93.7%
Median92.7%94.0%
Interquartile 25% (IQ1)89.8%92.2%
Interquartile 75% (IQ3)95.6%95.4%
Interquartile Range (IQR)5.8%3.1%
Standard Deviation (Sample)4.8%3.6%
Standard Deviation (Population)4.7%3.6%

Similar Demographics by 9th Grade

Demographics Similar to Nepalese by 9th Grade

In terms of 9th grade, the demographic groups most similar to Nepalese are Ecuadorian (91.9%, a difference of 0.050%), Nicaraguan (91.9%, a difference of 0.090%), Immigrants from Ecuador (91.8%, a difference of 0.16%), Belizean (91.8%, a difference of 0.19%), and Puerto Rican (91.8%, a difference of 0.19%).
DemographicsRating | Rank9th Grade
Immigrants | Fiji
0.0
/100
|
#311
Tragic
92.3%
Houma
0.0
/100
|
#312
Tragic
92.3%
Vietnamese
0.0
/100
|
#313
Tragic
92.3%
Immigrants | Portugal
0.0
/100
|
#314
Tragic
92.2%
Immigrants | Caribbean
0.0
/100
|
#315
Tragic
92.2%
Cape Verdeans
0.0
/100
|
#316
Tragic
92.2%
Immigrants | Cuba
0.0
/100
|
#317
Tragic
92.2%
Nepalese
0.0
/100
|
#318
Tragic
92.0%
Ecuadorians
0.0
/100
|
#319
Tragic
91.9%
Nicaraguans
0.0
/100
|
#320
Tragic
91.9%
Immigrants | Ecuador
0.0
/100
|
#321
Tragic
91.8%
Belizeans
0.0
/100
|
#322
Tragic
91.8%
Puerto Ricans
0.0
/100
|
#323
Tragic
91.8%
Immigrants | Belize
0.0
/100
|
#324
Tragic
91.8%
Central American Indians
0.0
/100
|
#325
Tragic
91.5%

Demographics Similar to South Americans by 9th Grade

In terms of 9th grade, the demographic groups most similar to South Americans are Pima (93.9%, a difference of 0.010%), Immigrants from Thailand (93.9%, a difference of 0.020%), Ghanaian (93.9%, a difference of 0.020%), Immigrants from Jamaica (93.9%, a difference of 0.020%), and Immigrants from Uzbekistan (93.9%, a difference of 0.020%).
DemographicsRating | Rank9th Grade
U.S. Virgin Islanders
0.7
/100
|
#254
Tragic
94.0%
Immigrants | Nigeria
0.6
/100
|
#255
Tragic
94.0%
Immigrants | Afghanistan
0.5
/100
|
#256
Tragic
94.0%
Immigrants | Costa Rica
0.5
/100
|
#257
Tragic
94.0%
Immigrants | Thailand
0.5
/100
|
#258
Tragic
93.9%
Ghanaians
0.5
/100
|
#259
Tragic
93.9%
Pima
0.4
/100
|
#260
Tragic
93.9%
South Americans
0.4
/100
|
#261
Tragic
93.9%
Immigrants | Jamaica
0.4
/100
|
#262
Tragic
93.9%
Immigrants | Uzbekistan
0.4
/100
|
#263
Tragic
93.9%
Immigrants | Congo
0.4
/100
|
#264
Tragic
93.9%
Natives/Alaskans
0.4
/100
|
#265
Tragic
93.9%
Navajo
0.3
/100
|
#266
Tragic
93.9%
Armenians
0.3
/100
|
#267
Tragic
93.9%
Immigrants | Bolivia
0.3
/100
|
#268
Tragic
93.9%