Navajo vs Cypriot Master's Degree
COMPARE
Navajo
Cypriot
Master's Degree
Master's Degree Comparison
Navajo
Cypriots
9.4%
MASTER'S DEGREE
0.0/ 100
METRIC RATING
341st/ 347
METRIC RANK
21.8%
MASTER'S DEGREE
100.0/ 100
METRIC RATING
8th/ 347
METRIC RANK
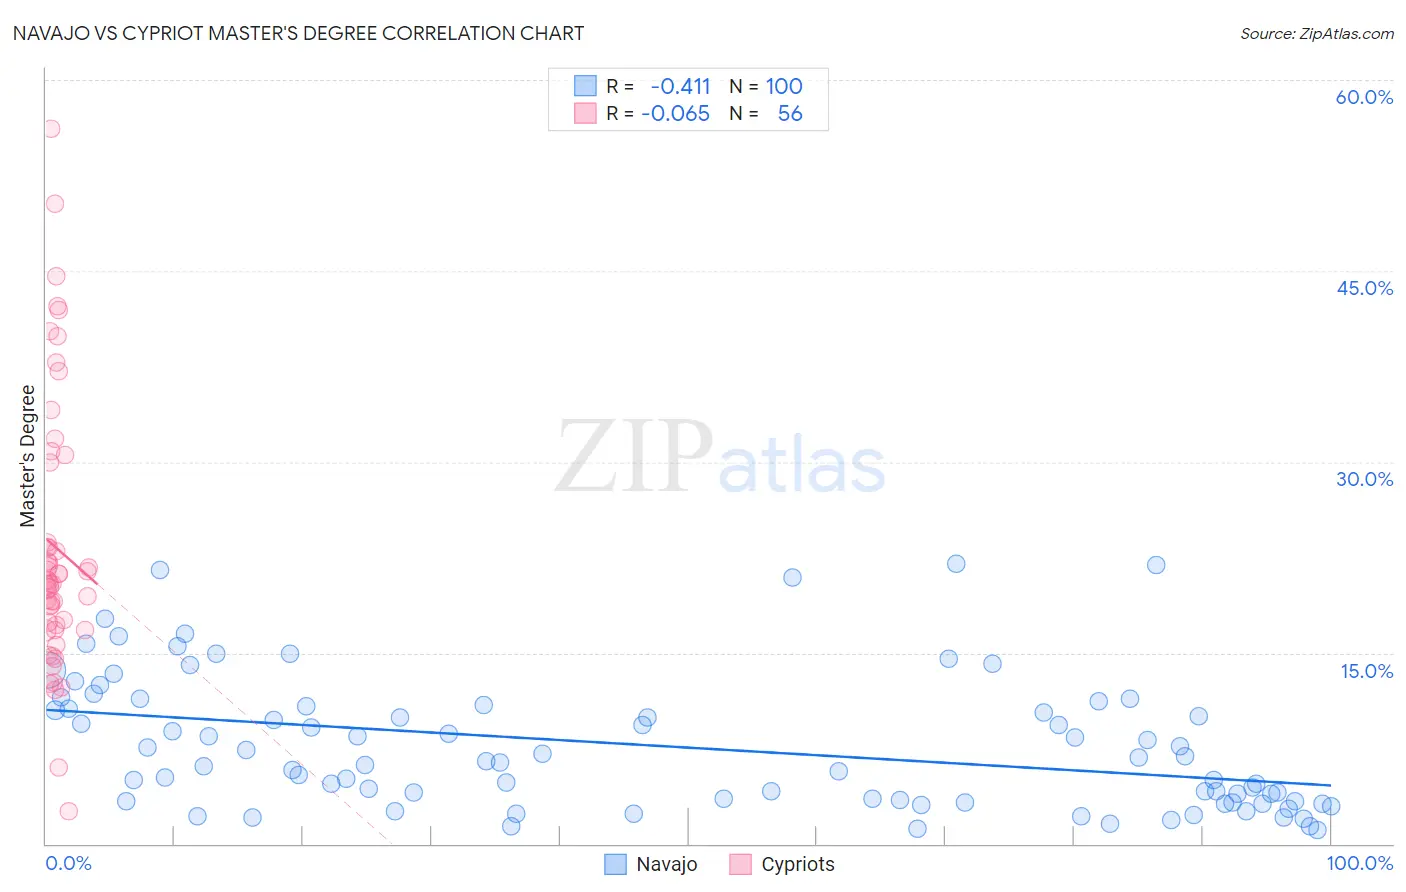
Navajo vs Cypriot Master's Degree Correlation Chart
The statistical analysis conducted on geographies consisting of 224,762,496 people shows a moderate negative correlation between the proportion of Navajo and percentage of population with at least master's degree education in the United States with a correlation coefficient (R) of -0.411 and weighted average of 9.4%. Similarly, the statistical analysis conducted on geographies consisting of 61,862,826 people shows a slight negative correlation between the proportion of Cypriots and percentage of population with at least master's degree education in the United States with a correlation coefficient (R) of -0.065 and weighted average of 21.8%, a difference of 131.1%.
Master's Degree Correlation Summary
| Measurement | Navajo | Cypriot |
| Minimum | 1.1% | 2.5% |
| Maximum | 22.0% | 56.1% |
| Range | 20.9% | 53.6% |
| Mean | 7.6% | 23.3% |
| Median | 6.3% | 20.5% |
| Interquartile 25% (IQ1) | 3.3% | 17.0% |
| Interquartile 75% (IQ3) | 10.7% | 26.8% |
| Interquartile Range (IQR) | 7.4% | 9.8% |
| Standard Deviation (Sample) | 5.2% | 10.7% |
| Standard Deviation (Population) | 5.1% | 10.6% |
Similar Demographics by Master's Degree
Demographics Similar to Navajo by Master's Degree
In terms of master's degree, the demographic groups most similar to Navajo are Yakama (9.5%, a difference of 0.35%), Immigrants from Mexico (9.3%, a difference of 1.3%), Spanish American Indian (9.6%, a difference of 1.6%), Lumbee (9.3%, a difference of 1.8%), and Pima (9.2%, a difference of 1.9%).
| Demographics | Rating | Rank | Master's Degree |
| Menominee | 0.0 /100 | #333 | Tragic 10.2% |
| Arapaho | 0.0 /100 | #334 | Tragic 10.0% |
| Immigrants | Central America | 0.0 /100 | #335 | Tragic 10.0% |
| Natives/Alaskans | 0.0 /100 | #336 | Tragic 9.9% |
| Mexicans | 0.0 /100 | #337 | Tragic 9.7% |
| Tohono O'odham | 0.0 /100 | #338 | Tragic 9.7% |
| Spanish American Indians | 0.0 /100 | #339 | Tragic 9.6% |
| Yakama | 0.0 /100 | #340 | Tragic 9.5% |
| Navajo | 0.0 /100 | #341 | Tragic 9.4% |
| Immigrants | Mexico | 0.0 /100 | #342 | Tragic 9.3% |
| Lumbee | 0.0 /100 | #343 | Tragic 9.3% |
| Pima | 0.0 /100 | #344 | Tragic 9.2% |
| Yuman | 0.0 /100 | #345 | Tragic 9.2% |
| Yup'ik | 0.0 /100 | #346 | Tragic 8.5% |
| Houma | 0.0 /100 | #347 | Tragic 7.9% |
Demographics Similar to Cypriots by Master's Degree
In terms of master's degree, the demographic groups most similar to Cypriots are Thai (21.7%, a difference of 0.34%), Immigrants from Iran (21.6%, a difference of 0.75%), Iranian (22.3%, a difference of 2.2%), Immigrants from India (22.3%, a difference of 2.4%), and Immigrants from China (21.2%, a difference of 2.9%).
| Demographics | Rating | Rank | Master's Degree |
| Immigrants | Singapore | 100.0 /100 | #1 | Exceptional 23.4% |
| Filipinos | 100.0 /100 | #2 | Exceptional 23.4% |
| Immigrants | Israel | 100.0 /100 | #3 | Exceptional 22.6% |
| Okinawans | 100.0 /100 | #4 | Exceptional 22.6% |
| Immigrants | Taiwan | 100.0 /100 | #5 | Exceptional 22.5% |
| Immigrants | India | 100.0 /100 | #6 | Exceptional 22.3% |
| Iranians | 100.0 /100 | #7 | Exceptional 22.3% |
| Cypriots | 100.0 /100 | #8 | Exceptional 21.8% |
| Thais | 100.0 /100 | #9 | Exceptional 21.7% |
| Immigrants | Iran | 100.0 /100 | #10 | Exceptional 21.6% |
| Immigrants | China | 100.0 /100 | #11 | Exceptional 21.2% |
| Eastern Europeans | 100.0 /100 | #12 | Exceptional 21.1% |
| Immigrants | Australia | 100.0 /100 | #13 | Exceptional 20.9% |
| Immigrants | Switzerland | 100.0 /100 | #14 | Exceptional 20.9% |
| Immigrants | Eastern Asia | 100.0 /100 | #15 | Exceptional 20.8% |