Native/Alaskan vs Immigrants from Denmark 7th Grade

COMPARE

Native/Alaskan
Race
Ancestry
AfghanAfricanAlaska NativeAlaskan AthabascanAlbanianAleutAlsatianAmericanApacheArabArapahoArgentineanArmenianAssyrian/Chaldean/SyriacAustralianAustrianBahamianBangladeshiBarbadianBasqueBelgianBelizeanBermudanBhutaneseBlackfeetBolivianBrazilianBritishBritish West IndianBulgarianBurmeseCajunCambodianCanadianCape VerdeanCarpatho RusynCelticCentral AmericanCentral American IndianCherokeeCheyenneChickasawChileanChineseChippewaChoctawColombianColvilleComancheCosta RicanCreeCreekCroatianCrowCubanCypriotCzechCzechoslovakianDanishDelawareDominicanDutchDutch West IndianEastern EuropeanEcuadorianEgyptianEnglishEstonianEthiopianEuropeanFijianFilipinoFinnishFrenchFrench American IndianFrench CanadianGermanGerman RussianGhanaianGreekGuamanian/ChamorroGuatemalanGuyaneseHaitianHmongHonduranHopiHoumaHungarianIcelanderIndian (Asian)IndonesianInupiatIranianIraqiIrishIroquoisIsraeliItalianJamaicanJapaneseJordanianKenyanKiowaKoreanLaotianLatvianLebaneseLiberianLithuanianLumbeeLuxembourgerMacedonianMalaysianMalteseMarshalleseMenomineeMexicanMexican American IndianMongolianMoroccanNative HawaiianNavajoNepaleseNew ZealanderNicaraguanNigerianNorthern EuropeanNorwegianOkinawanOsageOttawaPaiutePakistaniPalestinianPanamanianParaguayanPennsylvania GermanPeruvianPimaPolishPortuguesePotawatomiPuebloPuerto RicanPuget Sound SalishRomanianRussianSalvadoranSamoanScandinavianScotch-IrishScottishSeminoleSenegaleseSerbianShoshoneSierra LeoneanSiouxSlavicSlovakSloveneSomaliSouth AfricanSouth AmericanSouth American IndianSoviet UnionSpaniardSpanishSpanish AmericanSpanish American IndianSri LankanSubsaharan AfricanSudaneseSwedishSwissSyrianTaiwaneseThaiTlingit-HaidaTohono O'OdhamTonganTrinidadian and TobagonianTsimshianTurkishU.S. Virgin IslanderUgandanUkrainianUruguayanUteVenezuelanVietnameseWelshWest IndianYakamaYaquiYugoslavianYumanYup'ikZimbabwean
Immigration
NonimmigrantsImmigrantsAfghanistanAfricaAlbaniaArgentinaArmeniaAsiaAustraliaAustriaBahamasBangladeshBarbadosBelarusBelgiumBelizeBoliviaBosnia and HerzegovinaBrazilBulgariaBurma/MyanmarCabo VerdeCambodiaCameroonCanadaCaribbeanCentral AmericaChileChinaColombiaCongoCosta RicaCroatiaCubaCzechoslovakiaDominicaDominican RepublicEastern AfricaEastern AsiaEastern EuropeEcuadorEgyptEl SalvadorEnglandEritreaEthiopiaEuropeFijiFranceGermanyGhanaGreeceGrenadaGuatemalaGuyanaHaitiHondurasHong KongHungaryIndiaIndonesiaIranIraqIrelandIsraelItalyJamaicaJapanJordanKazakhstanKenyaKoreaKuwaitLaosLatin AmericaLatviaLebanonLiberiaLithuaniaMalaysiaMexicoMicronesiaMiddle AfricaMoldovaMoroccoNepalNetherlandsNicaraguaNigeriaNorth AmericaNorth MacedoniaNorthern AfricaNorthern EuropeNorwayOceaniaPakistanPanamaPeruPhilippinesPolandPortugalRomaniaRussiaSaudi ArabiaScotlandSenegalSerbiaSierra LeoneSingaporeSomaliaSouth AfricaSouth AmericaSouth Central AsiaSouth Eastern AsiaSouthern EuropeSpainSri LankaSt. Vincent and the GrenadinesSudanSwedenSwitzerlandSyriaTaiwanThailandTrinidad and TobagoTurkeyUgandaUkraineUruguayUzbekistanVenezuelaVietnamWest IndiesWestern AfricaWestern AsiaWestern EuropeYemenZaireZimbabweAzores
Immigrants from Denmark
Race
Ancestry
AfghanAfricanAlaska NativeAlaskan AthabascanAlbanianAleutAlsatianAmericanApacheArabArapahoArgentineanArmenianAssyrian/Chaldean/SyriacAustralianAustrianBahamianBangladeshiBarbadianBasqueBelgianBelizeanBermudanBhutaneseBlackfeetBolivianBrazilianBritishBritish West IndianBulgarianBurmeseCajunCambodianCanadianCape VerdeanCarpatho RusynCelticCentral AmericanCentral American IndianCherokeeCheyenneChickasawChileanChineseChippewaChoctawColombianColvilleComancheCosta RicanCreeCreekCroatianCrowCubanCypriotCzechCzechoslovakianDanishDelawareDominicanDutchDutch West IndianEastern EuropeanEcuadorianEgyptianEnglishEstonianEthiopianEuropeanFijianFilipinoFinnishFrenchFrench American IndianFrench CanadianGermanGerman RussianGhanaianGreekGuamanian/ChamorroGuatemalanGuyaneseHaitianHmongHonduranHopiHoumaHungarianIcelanderIndian (Asian)IndonesianInupiatIranianIraqiIrishIroquoisIsraeliItalianJamaicanJapaneseJordanianKenyanKiowaKoreanLaotianLatvianLebaneseLiberianLithuanianLumbeeLuxembourgerMacedonianMalaysianMalteseMarshalleseMenomineeMexicanMexican American IndianMongolianMoroccanNative HawaiianNavajoNepaleseNew ZealanderNicaraguanNigerianNorthern EuropeanNorwegianOkinawanOsageOttawaPaiutePakistaniPalestinianPanamanianParaguayanPennsylvania GermanPeruvianPimaPolishPortuguesePotawatomiPuebloPuerto RicanPuget Sound SalishRomanianRussianSalvadoranSamoanScandinavianScotch-IrishScottishSeminoleSenegaleseSerbianShoshoneSierra LeoneanSiouxSlavicSlovakSloveneSomaliSouth AfricanSouth AmericanSouth American IndianSoviet UnionSpaniardSpanishSpanish AmericanSpanish American IndianSri LankanSubsaharan AfricanSudaneseSwedishSwissSyrianTaiwaneseThaiTlingit-HaidaTohono O'OdhamTonganTrinidadian and TobagonianTsimshianTurkishU.S. Virgin IslanderUgandanUkrainianUruguayanUteVenezuelanVietnameseWelshWest IndianYakamaYaquiYugoslavianYumanYup'ikZimbabwean
Immigration
NonimmigrantsImmigrantsAfghanistanAfricaAlbaniaArgentinaArmeniaAsiaAustraliaAustriaBahamasBangladeshBarbadosBelarusBelgiumBelizeBoliviaBosnia and HerzegovinaBrazilBulgariaBurma/MyanmarCabo VerdeCambodiaCameroonCanadaCaribbeanCentral AmericaChileChinaColombiaCongoCosta RicaCroatiaCubaCzechoslovakiaDenmarkDominicaDominican RepublicEastern AfricaEastern AsiaEastern EuropeEcuadorEgyptEl SalvadorEnglandEritreaEthiopiaEuropeFijiFranceGermanyGhanaGreeceGrenadaGuatemalaGuyanaHaitiHondurasHong KongHungaryIndiaIndonesiaIranIraqIrelandIsraelItalyJamaicaJapanJordanKazakhstanKenyaKoreaKuwaitLaosLatin AmericaLatviaLebanonLiberiaLithuaniaMalaysiaMexicoMicronesiaMiddle AfricaMoldovaMoroccoNepalNetherlandsNicaraguaNigeriaNorth AmericaNorth MacedoniaNorthern AfricaNorthern EuropeNorwayOceaniaPakistanPanamaPeruPhilippinesPolandPortugalRomaniaRussiaSaudi ArabiaScotlandSenegalSerbiaSierra LeoneSingaporeSomaliaSouth AfricaSouth AmericaSouth Central AsiaSouth Eastern AsiaSouthern EuropeSpainSri LankaSt. Vincent and the GrenadinesSudanSwedenSwitzerlandSyriaTaiwanThailandTrinidad and TobagoTurkeyUgandaUkraineUruguayUzbekistanVenezuelaVietnamWest IndiesWestern AfricaWestern AsiaWestern EuropeYemenZaireZimbabweAzores
7th Grade
Income
Poverty
Unemployment
Labor Participation
Family Structure
Vehicle Availability
Education Level
Disability

7th Grade Comparison

Natives/Alaskans

Immigrants from Denmark

Tragic
Exceptional
95.6%
7TH GRADE
4.2/ 100
METRIC RATING
230th/ 347
METRIC RANK
96.7%
7TH GRADE
98.7/ 100
METRIC RATING
96th/ 347
METRIC RANK

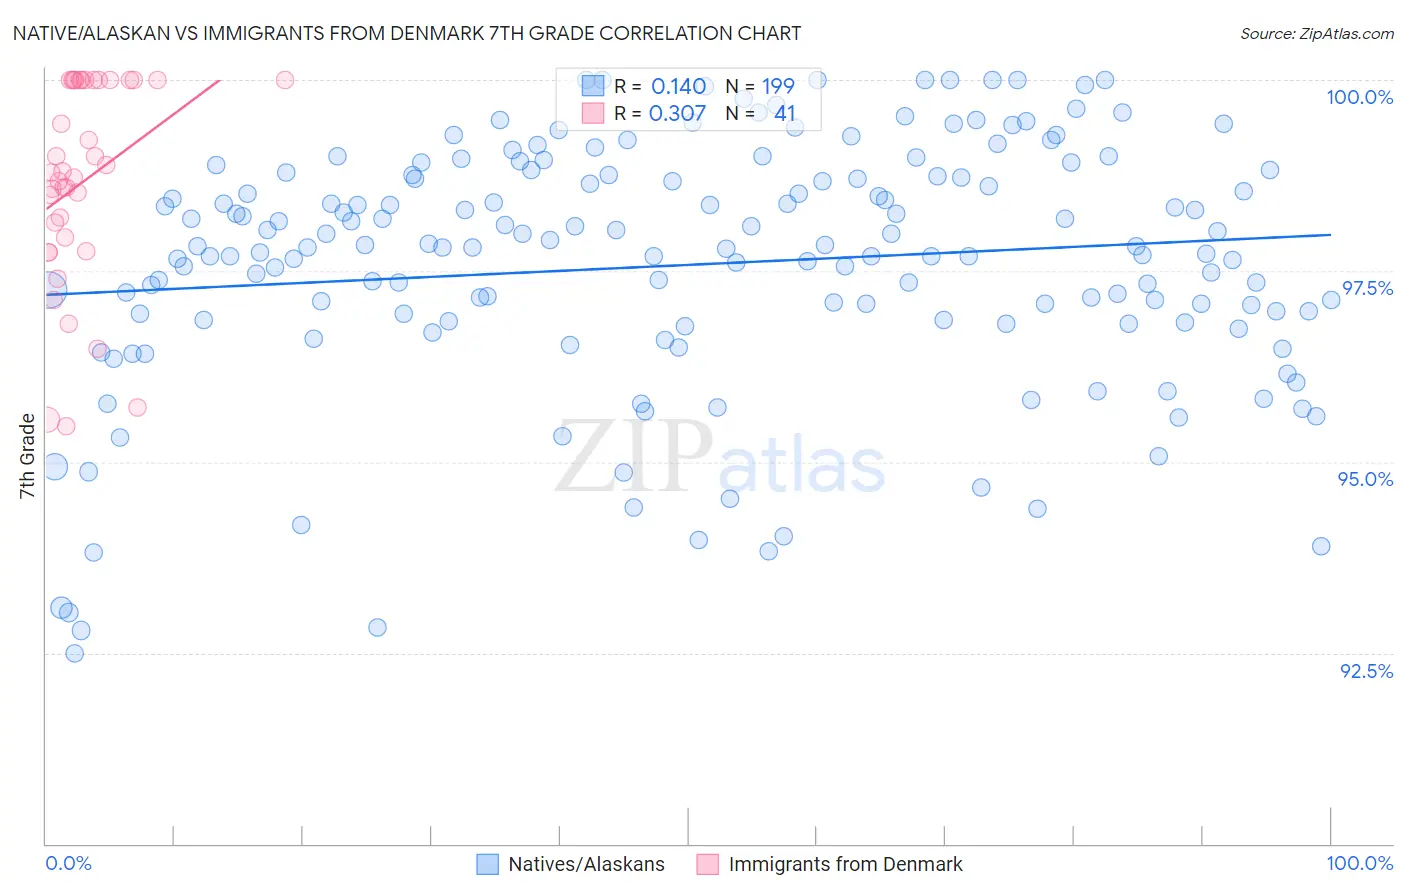
Native/Alaskan vs Immigrants from Denmark 7th Grade Correlation Chart

The statistical analysis conducted on geographies consisting of 513,072,559 people shows a poor positive correlation between the proportion of Natives/Alaskans and percentage of population with at least 7th grade education in the United States with a correlation coefficient (R) of 0.140 and weighted average of 95.6%. Similarly, the statistical analysis conducted on geographies consisting of 136,430,932 people shows a mild positive correlation between the proportion of Immigrants from Denmark and percentage of population with at least 7th grade education in the United States with a correlation coefficient (R) of 0.307 and weighted average of 96.7%, a difference of 1.1%.
Native/Alaskan vs Immigrants from Denmark 7th Grade

7th Grade Correlation Summary

MeasurementNative/AlaskanImmigrants from Denmark
Minimum92.5%95.5%
Maximum100.0%100.0%
Range7.5%4.5%
Mean97.6%98.7%
Median97.8%98.8%
Interquartile 25% (IQ1)96.8%97.9%
Interquartile 75% (IQ3)98.7%100.0%
Interquartile Range (IQR)1.9%2.1%
Standard Deviation (Sample)1.6%1.3%
Standard Deviation (Population)1.6%1.3%

Similar Demographics by 7th Grade

Demographics Similar to Natives/Alaskans by 7th Grade

In terms of 7th grade, the demographic groups most similar to Natives/Alaskans are Senegalese (95.6%, a difference of 0.010%), Immigrants from Panama (95.6%, a difference of 0.020%), Immigrants from Eastern Africa (95.6%, a difference of 0.030%), Immigrants from Western Asia (95.6%, a difference of 0.040%), and Costa Rican (95.5%, a difference of 0.040%).
DemographicsRating | Rank7th Grade
Immigrants | Syria
6.7
/100
|
#223
Tragic
95.7%
Immigrants | Oceania
6.7
/100
|
#224
Tragic
95.7%
Immigrants | Malaysia
6.2
/100
|
#225
Tragic
95.6%
Immigrants | Eastern Asia
5.8
/100
|
#226
Tragic
95.6%
Immigrants | Western Asia
5.4
/100
|
#227
Tragic
95.6%
Immigrants | Eastern Africa
5.1
/100
|
#228
Tragic
95.6%
Immigrants | Panama
4.9
/100
|
#229
Tragic
95.6%
Natives/Alaskans
4.2
/100
|
#230
Tragic
95.6%
Senegalese
4.0
/100
|
#231
Tragic
95.6%
Costa Ricans
3.3
/100
|
#232
Tragic
95.5%
Immigrants | Indonesia
3.3
/100
|
#233
Tragic
95.5%
Nigerians
3.0
/100
|
#234
Tragic
95.5%
Immigrants | Africa
2.7
/100
|
#235
Tragic
95.5%
Asians
2.6
/100
|
#236
Tragic
95.5%
Immigrants | Asia
2.3
/100
|
#237
Tragic
95.5%

Demographics Similar to Immigrants from Denmark by 7th Grade

In terms of 7th grade, the demographic groups most similar to Immigrants from Denmark are Immigrants from Germany (96.7%, a difference of 0.0%), Immigrants from Sweden (96.7%, a difference of 0.0%), Menominee (96.7%, a difference of 0.0%), Lebanese (96.7%, a difference of 0.010%), and Immigrants from Australia (96.7%, a difference of 0.010%).
DemographicsRating | Rank7th Grade
Cree
99.0
/100
|
#89
Exceptional
96.7%
Immigrants | South Africa
98.9
/100
|
#90
Exceptional
96.7%
Osage
98.9
/100
|
#91
Exceptional
96.7%
Immigrants | Western Europe
98.9
/100
|
#92
Exceptional
96.7%
Potawatomi
98.9
/100
|
#93
Exceptional
96.7%
Lebanese
98.8
/100
|
#94
Exceptional
96.7%
Immigrants | Australia
98.8
/100
|
#95
Exceptional
96.7%
Immigrants | Denmark
98.7
/100
|
#96
Exceptional
96.7%
Immigrants | Germany
98.7
/100
|
#97
Exceptional
96.7%
Immigrants | Sweden
98.7
/100
|
#98
Exceptional
96.7%
Menominee
98.7
/100
|
#99
Exceptional
96.7%
German Russians
98.6
/100
|
#100
Exceptional
96.7%
Thais
98.6
/100
|
#101
Exceptional
96.7%
Immigrants | Czechoslovakia
98.3
/100
|
#102
Exceptional
96.6%
Immigrants | Singapore
98.3
/100
|
#103
Exceptional
96.6%