Native Hawaiian vs Osage 11th Grade

COMPARE

Native Hawaiian
Race
Ancestry
AfghanAfricanAlaska NativeAlaskan AthabascanAlbanianAleutAlsatianAmericanApacheArabArapahoArgentineanArmenianAssyrian/Chaldean/SyriacAustralianAustrianBahamianBangladeshiBarbadianBasqueBelgianBelizeanBermudanBhutaneseBlackfeetBolivianBrazilianBritishBritish West IndianBulgarianBurmeseCajunCambodianCanadianCape VerdeanCarpatho RusynCelticCentral AmericanCentral American IndianCherokeeCheyenneChickasawChileanChineseChippewaChoctawColombianColvilleComancheCosta RicanCreeCreekCroatianCrowCubanCypriotCzechCzechoslovakianDanishDelawareDominicanDutchDutch West IndianEastern EuropeanEcuadorianEgyptianEnglishEstonianEthiopianEuropeanFijianFilipinoFinnishFrenchFrench American IndianFrench CanadianGermanGerman RussianGhanaianGreekGuamanian/ChamorroGuatemalanGuyaneseHaitianHmongHonduranHopiHoumaHungarianIcelanderIndian (Asian)IndonesianInupiatIranianIraqiIrishIroquoisIsraeliItalianJamaicanJapaneseJordanianKenyanKiowaKoreanLaotianLatvianLebaneseLiberianLithuanianLumbeeLuxembourgerMacedonianMalaysianMalteseMarshalleseMenomineeMexicanMexican American IndianMongolianMoroccanNative HawaiianNavajoNepaleseNew ZealanderNicaraguanNigerianNorthern EuropeanNorwegianOkinawanOttawaPaiutePakistaniPalestinianPanamanianParaguayanPennsylvania GermanPeruvianPimaPolishPortuguesePotawatomiPuebloPuerto RicanPuget Sound SalishRomanianRussianSalvadoranSamoanScandinavianScotch-IrishScottishSeminoleSenegaleseSerbianShoshoneSierra LeoneanSiouxSlavicSlovakSloveneSomaliSouth AfricanSouth AmericanSouth American IndianSoviet UnionSpaniardSpanishSpanish AmericanSpanish American IndianSri LankanSubsaharan AfricanSudaneseSwedishSwissSyrianTaiwaneseThaiTlingit-HaidaTohono O'OdhamTonganTrinidadian and TobagonianTsimshianTurkishU.S. Virgin IslanderUgandanUkrainianUruguayanUteVenezuelanVietnameseWelshWest IndianYakamaYaquiYugoslavianYumanYup'ikZimbabwean
Immigration
NonimmigrantsImmigrantsAfghanistanAfricaAlbaniaArgentinaArmeniaAsiaAustraliaAustriaBahamasBangladeshBarbadosBelarusBelgiumBelizeBoliviaBosnia and HerzegovinaBrazilBulgariaBurma/MyanmarCabo VerdeCambodiaCameroonCanadaCaribbeanCentral AmericaChileChinaColombiaCongoCosta RicaCroatiaCubaCzechoslovakiaDenmarkDominicaDominican RepublicEastern AfricaEastern AsiaEastern EuropeEcuadorEgyptEl SalvadorEnglandEritreaEthiopiaEuropeFijiFranceGermanyGhanaGreeceGrenadaGuatemalaGuyanaHaitiHondurasHong KongHungaryIndiaIndonesiaIranIraqIrelandIsraelItalyJamaicaJapanJordanKazakhstanKenyaKoreaKuwaitLaosLatin AmericaLatviaLebanonLiberiaLithuaniaMalaysiaMexicoMicronesiaMiddle AfricaMoldovaMoroccoNepalNetherlandsNicaraguaNigeriaNorth AmericaNorth MacedoniaNorthern AfricaNorthern EuropeNorwayOceaniaPakistanPanamaPeruPhilippinesPolandPortugalRomaniaRussiaSaudi ArabiaScotlandSenegalSerbiaSierra LeoneSingaporeSomaliaSouth AfricaSouth AmericaSouth Central AsiaSouth Eastern AsiaSouthern EuropeSpainSri LankaSt. Vincent and the GrenadinesSudanSwedenSwitzerlandSyriaTaiwanThailandTrinidad and TobagoTurkeyUgandaUkraineUruguayUzbekistanVenezuelaVietnamWest IndiesWestern AfricaWestern AsiaWestern EuropeYemenZaireZimbabweAzores
Osage
Race
Ancestry
AfghanAfricanAlaska NativeAlaskan AthabascanAlbanianAleutAlsatianAmericanApacheArabArapahoArgentineanArmenianAssyrian/Chaldean/SyriacAustralianAustrianBahamianBangladeshiBarbadianBasqueBelgianBelizeanBermudanBhutaneseBlackfeetBolivianBrazilianBritishBritish West IndianBulgarianBurmeseCajunCambodianCanadianCape VerdeanCarpatho RusynCelticCentral AmericanCentral American IndianCherokeeCheyenneChickasawChileanChineseChippewaChoctawColombianColvilleComancheCosta RicanCreeCreekCroatianCrowCubanCypriotCzechCzechoslovakianDanishDelawareDominicanDutchDutch West IndianEastern EuropeanEcuadorianEgyptianEnglishEstonianEthiopianEuropeanFijianFilipinoFinnishFrenchFrench American IndianFrench CanadianGermanGerman RussianGhanaianGreekGuamanian/ChamorroGuatemalanGuyaneseHaitianHmongHonduranHopiHoumaHungarianIcelanderIndian (Asian)IndonesianInupiatIranianIraqiIrishIroquoisIsraeliItalianJamaicanJapaneseJordanianKenyanKiowaKoreanLaotianLatvianLebaneseLiberianLithuanianLumbeeLuxembourgerMacedonianMalaysianMalteseMarshalleseMenomineeMexicanMexican American IndianMongolianMoroccanNavajoNepaleseNew ZealanderNicaraguanNigerianNorthern EuropeanNorwegianOkinawanOsageOttawaPaiutePakistaniPalestinianPanamanianParaguayanPennsylvania GermanPeruvianPimaPolishPortuguesePotawatomiPuebloPuerto RicanPuget Sound SalishRomanianRussianSalvadoranSamoanScandinavianScotch-IrishScottishSeminoleSenegaleseSerbianShoshoneSierra LeoneanSiouxSlavicSlovakSloveneSomaliSouth AfricanSouth AmericanSouth American IndianSoviet UnionSpaniardSpanishSpanish AmericanSpanish American IndianSri LankanSubsaharan AfricanSudaneseSwedishSwissSyrianTaiwaneseThaiTlingit-HaidaTohono O'OdhamTonganTrinidadian and TobagonianTsimshianTurkishU.S. Virgin IslanderUgandanUkrainianUruguayanUteVenezuelanVietnameseWelshWest IndianYakamaYaquiYugoslavianYumanYup'ikZimbabwean
Immigration
NonimmigrantsImmigrantsAfghanistanAfricaAlbaniaArgentinaArmeniaAsiaAustraliaAustriaBahamasBangladeshBarbadosBelarusBelgiumBelizeBoliviaBosnia and HerzegovinaBrazilBulgariaBurma/MyanmarCabo VerdeCambodiaCameroonCanadaCaribbeanCentral AmericaChileChinaColombiaCongoCosta RicaCroatiaCubaCzechoslovakiaDenmarkDominicaDominican RepublicEastern AfricaEastern AsiaEastern EuropeEcuadorEgyptEl SalvadorEnglandEritreaEthiopiaEuropeFijiFranceGermanyGhanaGreeceGrenadaGuatemalaGuyanaHaitiHondurasHong KongHungaryIndiaIndonesiaIranIraqIrelandIsraelItalyJamaicaJapanJordanKazakhstanKenyaKoreaKuwaitLaosLatin AmericaLatviaLebanonLiberiaLithuaniaMalaysiaMexicoMicronesiaMiddle AfricaMoldovaMoroccoNepalNetherlandsNicaraguaNigeriaNorth AmericaNorth MacedoniaNorthern AfricaNorthern EuropeNorwayOceaniaPakistanPanamaPeruPhilippinesPolandPortugalRomaniaRussiaSaudi ArabiaScotlandSenegalSerbiaSierra LeoneSingaporeSomaliaSouth AfricaSouth AmericaSouth Central AsiaSouth Eastern AsiaSouthern EuropeSpainSri LankaSt. Vincent and the GrenadinesSudanSwedenSwitzerlandSyriaTaiwanThailandTrinidad and TobagoTurkeyUgandaUkraineUruguayUzbekistanVenezuelaVietnamWest IndiesWestern AfricaWestern AsiaWestern EuropeYemenZaireZimbabweAzores
11th Grade
Income
Poverty
Unemployment
Labor Participation
Family Structure
Vehicle Availability
Education Level
Disability

11th Grade Comparison

Native Hawaiians

Osage

Exceptional
Good
93.9%
11TH GRADE
99.8/ 100
METRIC RATING
65th/ 347
METRIC RANK
92.7%
11TH GRADE
73.4/ 100
METRIC RATING
154th/ 347
METRIC RANK

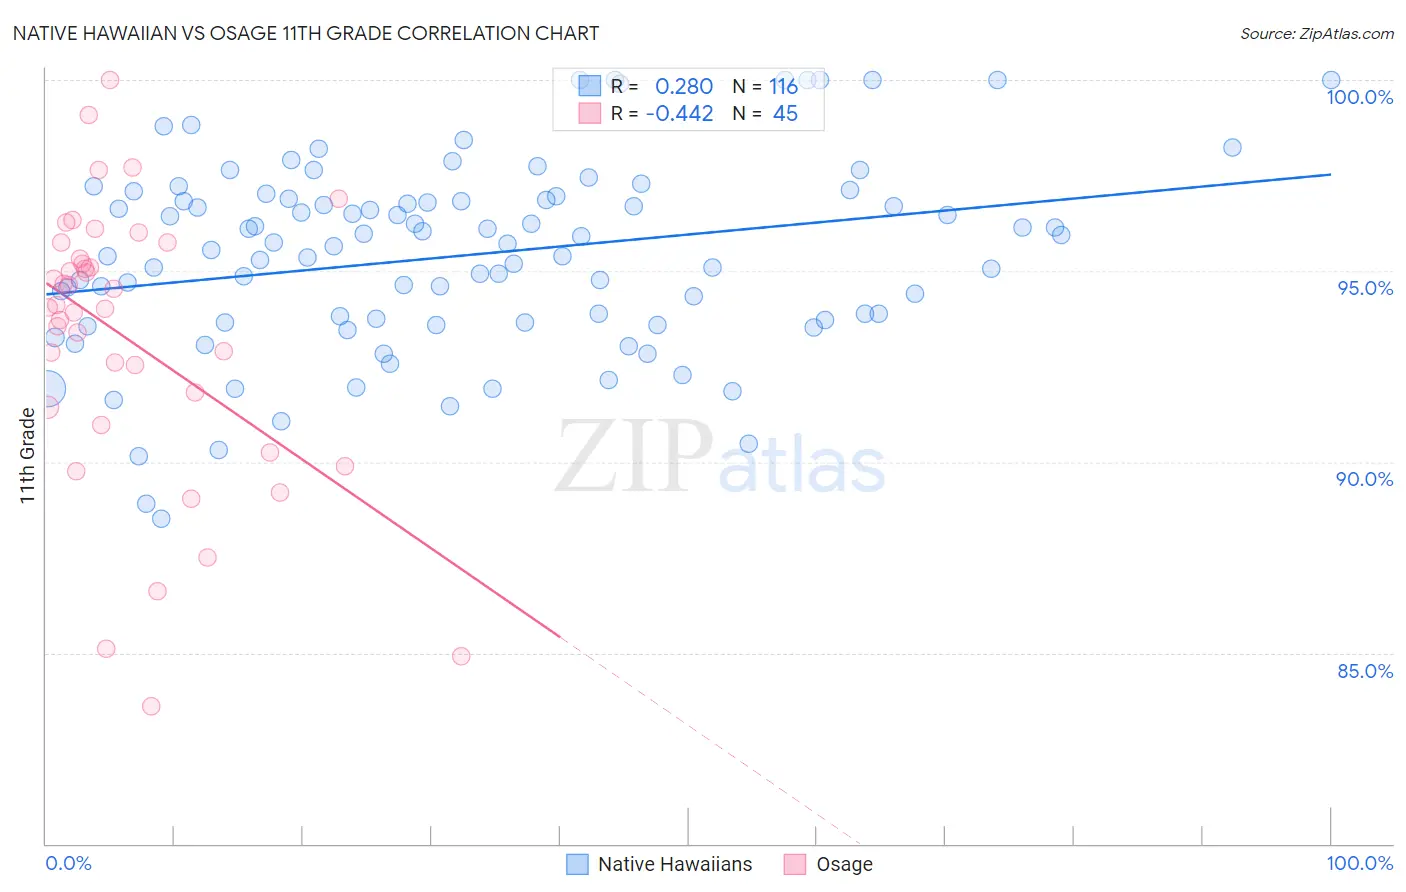
Native Hawaiian vs Osage 11th Grade Correlation Chart

The statistical analysis conducted on geographies consisting of 332,119,254 people shows a weak positive correlation between the proportion of Native Hawaiians and percentage of population with at least 11th grade education in the United States with a correlation coefficient (R) of 0.280 and weighted average of 93.9%. Similarly, the statistical analysis conducted on geographies consisting of 91,808,929 people shows a moderate negative correlation between the proportion of Osage and percentage of population with at least 11th grade education in the United States with a correlation coefficient (R) of -0.442 and weighted average of 92.7%, a difference of 1.3%.
Native Hawaiian vs Osage 11th Grade

11th Grade Correlation Summary

MeasurementNative HawaiianOsage
Minimum88.5%83.6%
Maximum100.0%100.0%
Range11.5%16.4%
Mean95.4%93.2%
Median95.7%94.1%
Interquartile 25% (IQ1)93.7%91.2%
Interquartile 75% (IQ3)96.9%95.5%
Interquartile Range (IQR)3.2%4.3%
Standard Deviation (Sample)2.5%3.7%
Standard Deviation (Population)2.5%3.6%

Similar Demographics by 11th Grade

Demographics Similar to Native Hawaiians by 11th Grade

In terms of 11th grade, the demographic groups most similar to Native Hawaiians are Immigrants from Sweden (93.9%, a difference of 0.0%), Alaskan Athabascan (93.9%, a difference of 0.020%), Immigrants from Netherlands (93.9%, a difference of 0.020%), Ukrainian (94.0%, a difference of 0.030%), and Zimbabwean (93.9%, a difference of 0.040%).
DemographicsRating | Rank11th Grade
Iranians
99.9
/100
|
#58
Exceptional
94.0%
Bhutanese
99.8
/100
|
#59
Exceptional
94.0%
Okinawans
99.8
/100
|
#60
Exceptional
94.0%
Immigrants | Belgium
99.8
/100
|
#61
Exceptional
94.0%
Austrians
99.8
/100
|
#62
Exceptional
94.0%
Ukrainians
99.8
/100
|
#63
Exceptional
94.0%
Immigrants | Sweden
99.8
/100
|
#64
Exceptional
93.9%
Native Hawaiians
99.8
/100
|
#65
Exceptional
93.9%
Alaskan Athabascans
99.8
/100
|
#66
Exceptional
93.9%
Immigrants | Netherlands
99.8
/100
|
#67
Exceptional
93.9%
Zimbabweans
99.8
/100
|
#68
Exceptional
93.9%
Scotch-Irish
99.8
/100
|
#69
Exceptional
93.9%
Immigrants | England
99.7
/100
|
#70
Exceptional
93.8%
Immigrants | South Africa
99.7
/100
|
#71
Exceptional
93.8%
Immigrants | Japan
99.7
/100
|
#72
Exceptional
93.8%

Demographics Similar to Osage by 11th Grade

In terms of 11th grade, the demographic groups most similar to Osage are Argentinean (92.7%, a difference of 0.0%), Immigrants from Spain (92.7%, a difference of 0.0%), Potawatomi (92.8%, a difference of 0.010%), Iraqi (92.8%, a difference of 0.010%), and Brazilian (92.8%, a difference of 0.010%).
DemographicsRating | Rank11th Grade
Immigrants | Kenya
78.7
/100
|
#147
Good
92.8%
Hmong
78.6
/100
|
#148
Good
92.8%
Immigrants | Poland
78.5
/100
|
#149
Good
92.8%
Immigrants | Egypt
77.5
/100
|
#150
Good
92.8%
Potawatomi
74.3
/100
|
#151
Good
92.8%
Iraqis
74.2
/100
|
#152
Good
92.8%
Brazilians
73.9
/100
|
#153
Good
92.8%
Osage
73.4
/100
|
#154
Good
92.7%
Argentineans
73.4
/100
|
#155
Good
92.7%
Immigrants | Spain
73.0
/100
|
#156
Good
92.7%
Immigrants | Eastern Asia
72.6
/100
|
#157
Good
92.7%
Immigrants | Venezuela
72.0
/100
|
#158
Good
92.7%
Americans
71.7
/100
|
#159
Good
92.7%
Immigrants | Lebanon
70.7
/100
|
#160
Good
92.7%
Immigrants | Argentina
69.8
/100
|
#161
Good
92.7%