Native Hawaiian vs Immigrants from Sierra Leone 5th Grade

COMPARE

Native Hawaiian
Race
Ancestry
AfghanAfricanAlaska NativeAlaskan AthabascanAlbanianAleutAlsatianAmericanApacheArabArapahoArgentineanArmenianAssyrian/Chaldean/SyriacAustralianAustrianBahamianBangladeshiBarbadianBasqueBelgianBelizeanBermudanBhutaneseBlackfeetBolivianBrazilianBritishBritish West IndianBulgarianBurmeseCajunCambodianCanadianCape VerdeanCarpatho RusynCelticCentral AmericanCentral American IndianCherokeeCheyenneChickasawChileanChineseChippewaChoctawColombianColvilleComancheCosta RicanCreeCreekCroatianCrowCubanCypriotCzechCzechoslovakianDanishDelawareDominicanDutchDutch West IndianEastern EuropeanEcuadorianEgyptianEnglishEstonianEthiopianEuropeanFijianFilipinoFinnishFrenchFrench American IndianFrench CanadianGermanGerman RussianGhanaianGreekGuamanian/ChamorroGuatemalanGuyaneseHaitianHmongHonduranHopiHoumaHungarianIcelanderIndian (Asian)IndonesianInupiatIranianIraqiIrishIroquoisIsraeliItalianJamaicanJapaneseJordanianKenyanKiowaKoreanLaotianLatvianLebaneseLiberianLithuanianLumbeeLuxembourgerMacedonianMalaysianMalteseMarshalleseMenomineeMexicanMexican American IndianMongolianMoroccanNative HawaiianNavajoNepaleseNew ZealanderNicaraguanNigerianNorthern EuropeanNorwegianOkinawanOsageOttawaPaiutePakistaniPalestinianPanamanianParaguayanPennsylvania GermanPeruvianPimaPolishPortuguesePotawatomiPuebloPuerto RicanPuget Sound SalishRomanianRussianSalvadoranSamoanScandinavianScotch-IrishScottishSeminoleSenegaleseSerbianShoshoneSierra LeoneanSiouxSlavicSlovakSloveneSomaliSouth AfricanSouth AmericanSouth American IndianSoviet UnionSpaniardSpanishSpanish AmericanSpanish American IndianSri LankanSubsaharan AfricanSudaneseSwedishSwissSyrianTaiwaneseThaiTlingit-HaidaTohono O'OdhamTonganTrinidadian and TobagonianTsimshianTurkishU.S. Virgin IslanderUgandanUkrainianUruguayanUteVenezuelanVietnameseWelshWest IndianYakamaYaquiYugoslavianYumanYup'ikZimbabwean
Immigration
NonimmigrantsImmigrantsAfghanistanAfricaAlbaniaArgentinaArmeniaAsiaAustraliaAustriaBahamasBangladeshBarbadosBelarusBelgiumBelizeBoliviaBosnia and HerzegovinaBrazilBulgariaBurma/MyanmarCabo VerdeCambodiaCameroonCanadaCaribbeanCentral AmericaChileChinaColombiaCongoCosta RicaCroatiaCubaCzechoslovakiaDenmarkDominicaDominican RepublicEastern AfricaEastern AsiaEastern EuropeEcuadorEgyptEl SalvadorEnglandEritreaEthiopiaEuropeFijiFranceGermanyGhanaGreeceGrenadaGuatemalaGuyanaHaitiHondurasHong KongHungaryIndiaIndonesiaIranIraqIrelandIsraelItalyJamaicaJapanJordanKazakhstanKenyaKoreaKuwaitLaosLatin AmericaLatviaLebanonLiberiaLithuaniaMalaysiaMexicoMicronesiaMiddle AfricaMoldovaMoroccoNepalNetherlandsNicaraguaNigeriaNorth AmericaNorth MacedoniaNorthern AfricaNorthern EuropeNorwayOceaniaPakistanPanamaPeruPhilippinesPolandPortugalRomaniaRussiaSaudi ArabiaScotlandSenegalSerbiaSingaporeSomaliaSouth AfricaSouth AmericaSouth Central AsiaSouth Eastern AsiaSouthern EuropeSpainSri LankaSt. Vincent and the GrenadinesSudanSwedenSwitzerlandSyriaTaiwanThailandTrinidad and TobagoTurkeyUgandaUkraineUruguayUzbekistanVenezuelaVietnamWest IndiesWestern AfricaWestern AsiaWestern EuropeYemenZaireZimbabweAzores
Immigrants from Sierra Leone
Race
Ancestry
AfghanAfricanAlaska NativeAlaskan AthabascanAlbanianAleutAlsatianAmericanApacheArabArapahoArgentineanArmenianAssyrian/Chaldean/SyriacAustralianAustrianBahamianBangladeshiBarbadianBasqueBelgianBelizeanBermudanBhutaneseBlackfeetBolivianBrazilianBritishBritish West IndianBulgarianBurmeseCajunCambodianCanadianCape VerdeanCarpatho RusynCelticCentral AmericanCentral American IndianCherokeeCheyenneChickasawChileanChineseChippewaChoctawColombianColvilleComancheCosta RicanCreeCreekCroatianCrowCubanCypriotCzechCzechoslovakianDanishDelawareDominicanDutchDutch West IndianEastern EuropeanEcuadorianEgyptianEnglishEstonianEthiopianEuropeanFijianFilipinoFinnishFrenchFrench American IndianFrench CanadianGermanGerman RussianGhanaianGreekGuamanian/ChamorroGuatemalanGuyaneseHaitianHmongHonduranHopiHoumaHungarianIcelanderIndian (Asian)IndonesianInupiatIranianIraqiIrishIroquoisIsraeliItalianJamaicanJapaneseJordanianKenyanKiowaKoreanLaotianLatvianLebaneseLiberianLithuanianLumbeeLuxembourgerMacedonianMalaysianMalteseMarshalleseMenomineeMexicanMexican American IndianMongolianMoroccanNavajoNepaleseNew ZealanderNicaraguanNigerianNorthern EuropeanNorwegianOkinawanOsageOttawaPaiutePakistaniPalestinianPanamanianParaguayanPennsylvania GermanPeruvianPimaPolishPortuguesePotawatomiPuebloPuerto RicanPuget Sound SalishRomanianRussianSalvadoranSamoanScandinavianScotch-IrishScottishSeminoleSenegaleseSerbianShoshoneSierra LeoneanSiouxSlavicSlovakSloveneSomaliSouth AfricanSouth AmericanSouth American IndianSoviet UnionSpaniardSpanishSpanish AmericanSpanish American IndianSri LankanSubsaharan AfricanSudaneseSwedishSwissSyrianTaiwaneseThaiTlingit-HaidaTohono O'OdhamTonganTrinidadian and TobagonianTsimshianTurkishU.S. Virgin IslanderUgandanUkrainianUruguayanUteVenezuelanVietnameseWelshWest IndianYakamaYaquiYugoslavianYumanYup'ikZimbabwean
Immigration
NonimmigrantsImmigrantsAfghanistanAfricaAlbaniaArgentinaArmeniaAsiaAustraliaAustriaBahamasBangladeshBarbadosBelarusBelgiumBelizeBoliviaBosnia and HerzegovinaBrazilBulgariaBurma/MyanmarCabo VerdeCambodiaCameroonCanadaCaribbeanCentral AmericaChileChinaColombiaCongoCosta RicaCroatiaCubaCzechoslovakiaDenmarkDominicaDominican RepublicEastern AfricaEastern AsiaEastern EuropeEcuadorEgyptEl SalvadorEnglandEritreaEthiopiaEuropeFijiFranceGermanyGhanaGreeceGrenadaGuatemalaGuyanaHaitiHondurasHong KongHungaryIndiaIndonesiaIranIraqIrelandIsraelItalyJamaicaJapanJordanKazakhstanKenyaKoreaKuwaitLaosLatin AmericaLatviaLebanonLiberiaLithuaniaMalaysiaMexicoMicronesiaMiddle AfricaMoldovaMoroccoNepalNetherlandsNicaraguaNigeriaNorth AmericaNorth MacedoniaNorthern AfricaNorthern EuropeNorwayOceaniaPakistanPanamaPeruPhilippinesPolandPortugalRomaniaRussiaSaudi ArabiaScotlandSenegalSerbiaSierra LeoneSingaporeSomaliaSouth AfricaSouth AmericaSouth Central AsiaSouth Eastern AsiaSouthern EuropeSpainSri LankaSt. Vincent and the GrenadinesSudanSwedenSwitzerlandSyriaTaiwanThailandTrinidad and TobagoTurkeyUgandaUkraineUruguayUzbekistanVenezuelaVietnamWest IndiesWestern AfricaWestern AsiaWestern EuropeYemenZaireZimbabweAzores
5th Grade
Income
Poverty
Unemployment
Labor Participation
Family Structure
Vehicle Availability
Education Level
Disability

5th Grade Comparison

Native Hawaiians

Immigrants from Sierra Leone

Exceptional
Tragic
98.0%
5TH GRADE
99.9/ 100
METRIC RATING
47th/ 347
METRIC RANK
96.8%
5TH GRADE
0.4/ 100
METRIC RATING
261st/ 347
METRIC RANK

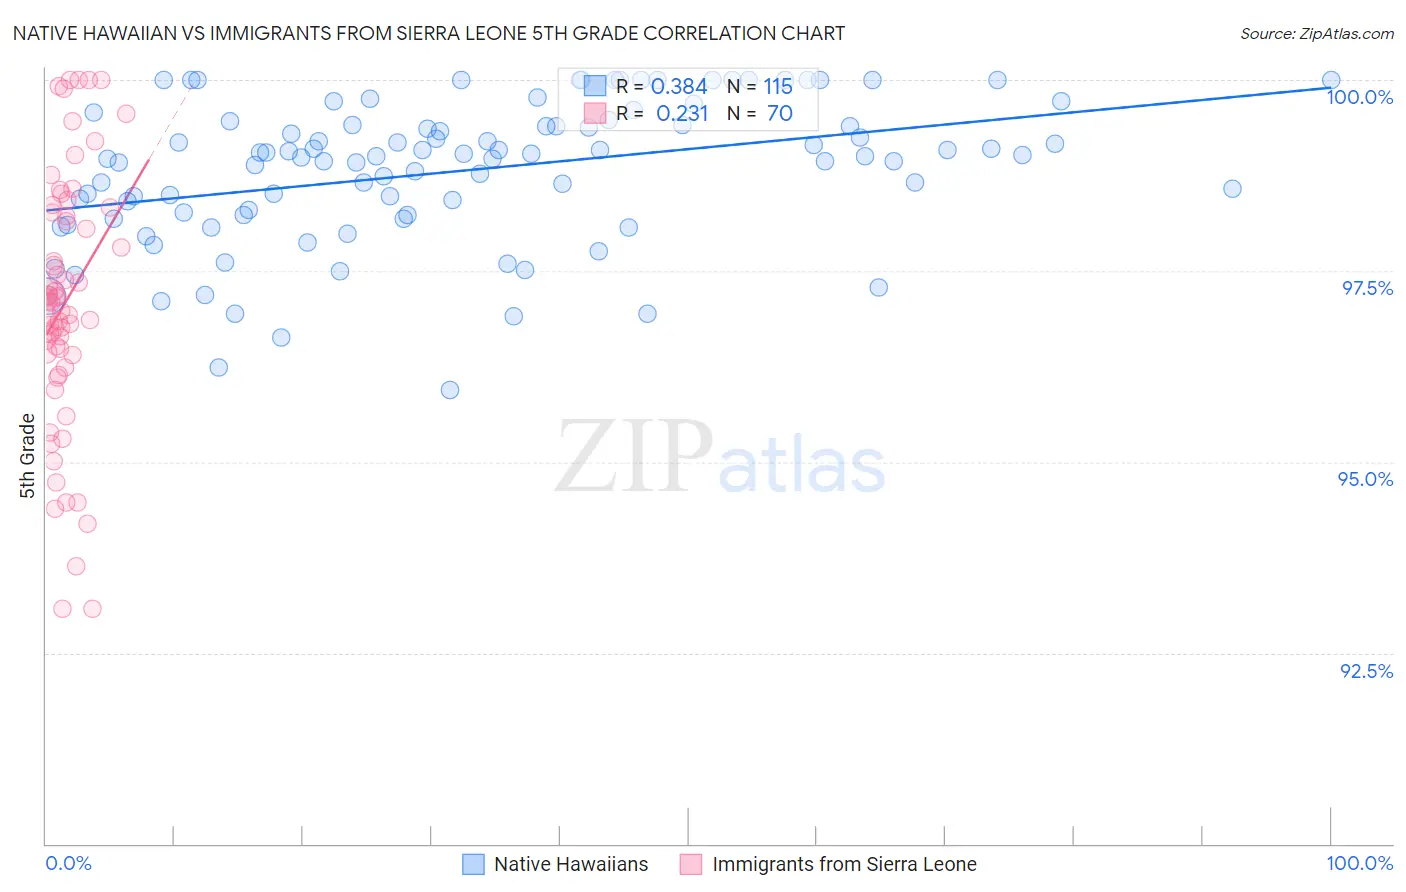
Native Hawaiian vs Immigrants from Sierra Leone 5th Grade Correlation Chart

The statistical analysis conducted on geographies consisting of 332,113,170 people shows a mild positive correlation between the proportion of Native Hawaiians and percentage of population with at least 5th grade education in the United States with a correlation coefficient (R) of 0.384 and weighted average of 98.0%. Similarly, the statistical analysis conducted on geographies consisting of 101,634,956 people shows a weak positive correlation between the proportion of Immigrants from Sierra Leone and percentage of population with at least 5th grade education in the United States with a correlation coefficient (R) of 0.231 and weighted average of 96.8%, a difference of 1.3%.
Native Hawaiian vs Immigrants from Sierra Leone 5th Grade

5th Grade Correlation Summary

MeasurementNative HawaiianImmigrants from Sierra Leone
Minimum95.9%93.1%
Maximum100.0%100.0%
Range4.1%6.9%
Mean98.8%97.1%
Median99.0%97.1%
Interquartile 25% (IQ1)98.2%96.4%
Interquartile 75% (IQ3)99.4%98.3%
Interquartile Range (IQR)1.2%1.9%
Standard Deviation (Sample)0.93%1.7%
Standard Deviation (Population)0.93%1.7%

Similar Demographics by 5th Grade

Demographics Similar to Native Hawaiians by 5th Grade

In terms of 5th grade, the demographic groups most similar to Native Hawaiians are Czechoslovakian (98.0%, a difference of 0.010%), Arapaho (98.0%, a difference of 0.010%), Bulgarian (98.0%, a difference of 0.010%), Aleut (98.0%, a difference of 0.020%), and Estonian (98.0%, a difference of 0.020%).
DemographicsRating | Rank5th Grade
Eastern Europeans
99.9
/100
|
#40
Exceptional
98.1%
Hungarians
99.9
/100
|
#41
Exceptional
98.0%
Northern Europeans
99.9
/100
|
#42
Exceptional
98.0%
Ottawa
99.9
/100
|
#43
Exceptional
98.0%
Aleuts
99.9
/100
|
#44
Exceptional
98.0%
Czechoslovakians
99.9
/100
|
#45
Exceptional
98.0%
Arapaho
99.9
/100
|
#46
Exceptional
98.0%
Native Hawaiians
99.9
/100
|
#47
Exceptional
98.0%
Bulgarians
99.8
/100
|
#48
Exceptional
98.0%
Estonians
99.8
/100
|
#49
Exceptional
98.0%
Immigrants | Scotland
99.8
/100
|
#50
Exceptional
98.0%
Celtics
99.8
/100
|
#51
Exceptional
98.0%
Maltese
99.8
/100
|
#52
Exceptional
98.0%
Slavs
99.8
/100
|
#53
Exceptional
98.0%
Australians
99.8
/100
|
#54
Exceptional
98.0%

Demographics Similar to Immigrants from Sierra Leone by 5th Grade

In terms of 5th grade, the demographic groups most similar to Immigrants from Sierra Leone are Immigrants from Jamaica (96.8%, a difference of 0.0%), Immigrants from Colombia (96.8%, a difference of 0.0%), Immigrants from Uzbekistan (96.8%, a difference of 0.010%), Immigrants from Ethiopia (96.8%, a difference of 0.020%), and Immigrants from China (96.8%, a difference of 0.020%).
DemographicsRating | Rank5th Grade
Immigrants | Senegal
0.8
/100
|
#254
Tragic
96.8%
South Americans
0.7
/100
|
#255
Tragic
96.8%
Immigrants | Congo
0.7
/100
|
#256
Tragic
96.8%
Peruvians
0.6
/100
|
#257
Tragic
96.8%
Immigrants | Ethiopia
0.5
/100
|
#258
Tragic
96.8%
Immigrants | China
0.5
/100
|
#259
Tragic
96.8%
Immigrants | Jamaica
0.4
/100
|
#260
Tragic
96.8%
Immigrants | Sierra Leone
0.4
/100
|
#261
Tragic
96.8%
Immigrants | Colombia
0.4
/100
|
#262
Tragic
96.8%
Immigrants | Uzbekistan
0.3
/100
|
#263
Tragic
96.8%
West Indians
0.3
/100
|
#264
Tragic
96.8%
Taiwanese
0.3
/100
|
#265
Tragic
96.7%
Immigrants | Nigeria
0.3
/100
|
#266
Tragic
96.7%
Immigrants | South America
0.3
/100
|
#267
Tragic
96.7%
Armenians
0.3
/100
|
#268
Tragic
96.7%