Native Hawaiian vs Immigrants from Serbia Doctorate Degree
COMPARE
Native Hawaiian
Immigrants from Serbia
Doctorate Degree
Doctorate Degree Comparison
Native Hawaiians
Immigrants from Serbia
1.6%
DOCTORATE DEGREE
2.1/ 100
METRIC RATING
243rd/ 347
METRIC RANK
2.3%
DOCTORATE DEGREE
99.9/ 100
METRIC RATING
60th/ 347
METRIC RANK
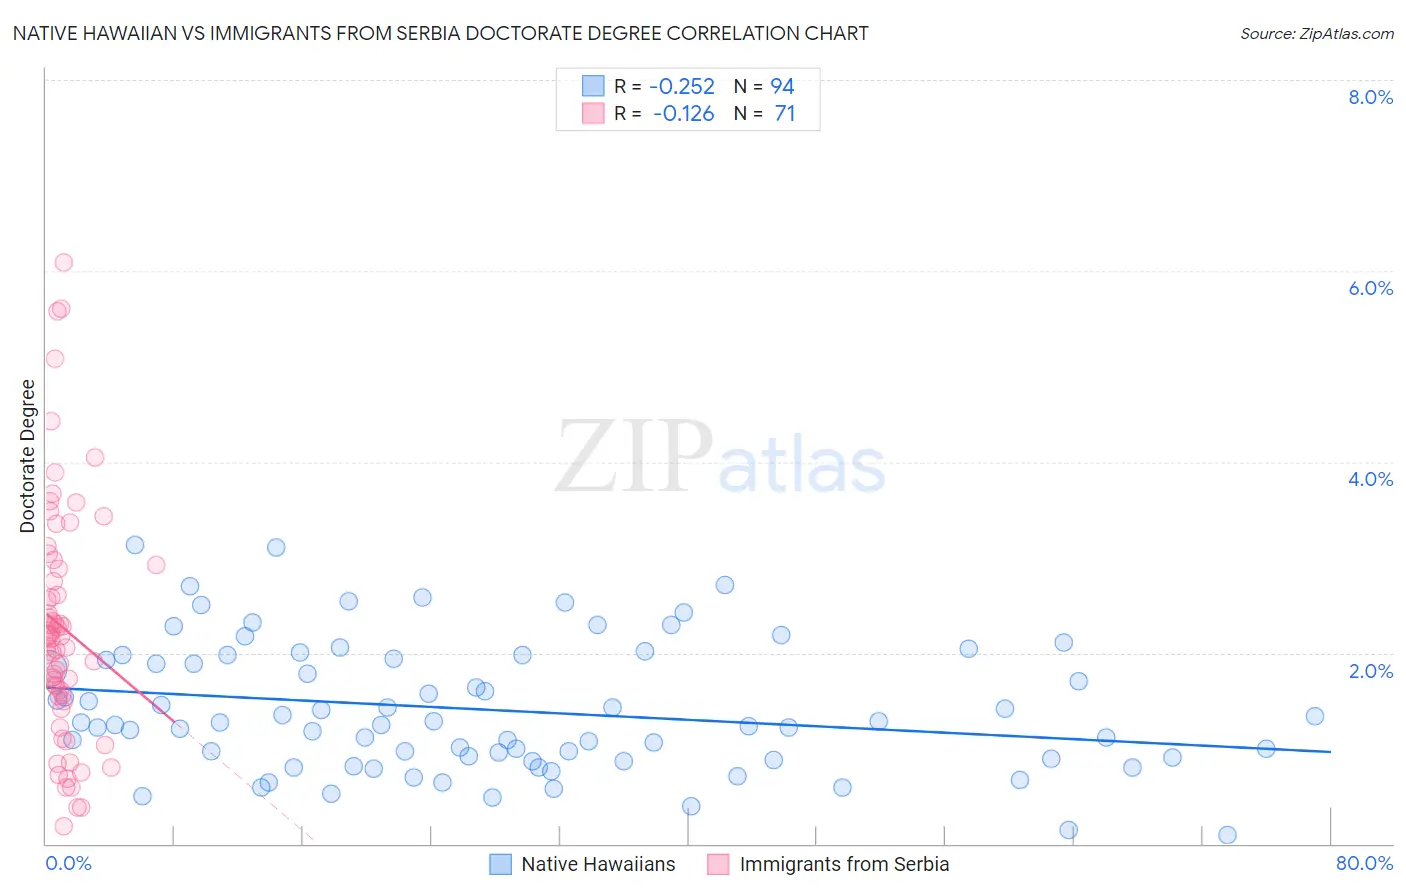
Native Hawaiian vs Immigrants from Serbia Doctorate Degree Correlation Chart
The statistical analysis conducted on geographies consisting of 328,309,931 people shows a weak negative correlation between the proportion of Native Hawaiians and percentage of population with at least doctorate degree education in the United States with a correlation coefficient (R) of -0.252 and weighted average of 1.6%. Similarly, the statistical analysis conducted on geographies consisting of 131,505,756 people shows a poor negative correlation between the proportion of Immigrants from Serbia and percentage of population with at least doctorate degree education in the United States with a correlation coefficient (R) of -0.126 and weighted average of 2.3%, a difference of 48.0%.
Doctorate Degree Correlation Summary
| Measurement | Native Hawaiian | Immigrants from Serbia |
| Minimum | 0.092% | 0.19% |
| Maximum | 3.1% | 6.1% |
| Range | 3.0% | 5.9% |
| Mean | 1.4% | 2.3% |
| Median | 1.3% | 2.2% |
| Interquartile 25% (IQ1) | 0.89% | 1.5% |
| Interquartile 75% (IQ3) | 1.9% | 2.9% |
| Interquartile Range (IQR) | 1.1% | 1.4% |
| Standard Deviation (Sample) | 0.67% | 1.3% |
| Standard Deviation (Population) | 0.67% | 1.2% |
Similar Demographics by Doctorate Degree
Demographics Similar to Native Hawaiians by Doctorate Degree
In terms of doctorate degree, the demographic groups most similar to Native Hawaiians are Ottawa (1.6%, a difference of 0.13%), French American Indian (1.6%, a difference of 0.19%), Cheyenne (1.6%, a difference of 0.34%), Immigrants from Panama (1.6%, a difference of 0.53%), and Delaware (1.6%, a difference of 0.57%).
| Demographics | Rating | Rank | Doctorate Degree |
| Indonesians | 2.8 /100 | #236 | Tragic 1.6% |
| Iroquois | 2.7 /100 | #237 | Tragic 1.6% |
| Immigrants | Congo | 2.6 /100 | #238 | Tragic 1.6% |
| West Indians | 2.5 /100 | #239 | Tragic 1.6% |
| Immigrants | Panama | 2.4 /100 | #240 | Tragic 1.6% |
| Cheyenne | 2.3 /100 | #241 | Tragic 1.6% |
| Ottawa | 2.2 /100 | #242 | Tragic 1.6% |
| Native Hawaiians | 2.1 /100 | #243 | Tragic 1.6% |
| French American Indians | 2.0 /100 | #244 | Tragic 1.6% |
| Delaware | 1.9 /100 | #245 | Tragic 1.6% |
| Hmong | 1.8 /100 | #246 | Tragic 1.6% |
| Comanche | 1.8 /100 | #247 | Tragic 1.6% |
| Africans | 1.8 /100 | #248 | Tragic 1.6% |
| Potawatomi | 1.6 /100 | #249 | Tragic 1.6% |
| Immigrants | Fiji | 1.6 /100 | #250 | Tragic 1.6% |
Demographics Similar to Immigrants from Serbia by Doctorate Degree
In terms of doctorate degree, the demographic groups most similar to Immigrants from Serbia are South African (2.3%, a difference of 0.020%), Ethiopian (2.3%, a difference of 0.46%), Immigrants from Ethiopia (2.4%, a difference of 0.58%), Bhutanese (2.3%, a difference of 0.77%), and Immigrants from Czechoslovakia (2.4%, a difference of 1.0%).
| Demographics | Rating | Rank | Doctorate Degree |
| Immigrants | Latvia | 100.0 /100 | #53 | Exceptional 2.4% |
| Immigrants | Indonesia | 100.0 /100 | #54 | Exceptional 2.4% |
| Bolivians | 100.0 /100 | #55 | Exceptional 2.4% |
| Immigrants | Czechoslovakia | 100.0 /100 | #56 | Exceptional 2.4% |
| Immigrants | Ethiopia | 100.0 /100 | #57 | Exceptional 2.4% |
| Ethiopians | 99.9 /100 | #58 | Exceptional 2.3% |
| South Africans | 99.9 /100 | #59 | Exceptional 2.3% |
| Immigrants | Serbia | 99.9 /100 | #60 | Exceptional 2.3% |
| Bhutanese | 99.9 /100 | #61 | Exceptional 2.3% |
| Immigrants | Europe | 99.9 /100 | #62 | Exceptional 2.3% |
| Laotians | 99.9 /100 | #63 | Exceptional 2.3% |
| Immigrants | Greece | 99.9 /100 | #64 | Exceptional 2.3% |
| Paraguayans | 99.9 /100 | #65 | Exceptional 2.3% |
| Argentineans | 99.9 /100 | #66 | Exceptional 2.3% |
| Zimbabweans | 99.8 /100 | #67 | Exceptional 2.3% |