Native Hawaiian vs Immigrants from Italy Bachelor's Degree

COMPARE

Native Hawaiian
Race
Ancestry
AfghanAfricanAlaska NativeAlaskan AthabascanAlbanianAleutAlsatianAmericanApacheArabArapahoArgentineanArmenianAssyrian/Chaldean/SyriacAustralianAustrianBahamianBangladeshiBarbadianBasqueBelgianBelizeanBermudanBhutaneseBlackfeetBolivianBrazilianBritishBritish West IndianBulgarianBurmeseCajunCambodianCanadianCape VerdeanCarpatho RusynCelticCentral AmericanCentral American IndianCherokeeCheyenneChickasawChileanChineseChippewaChoctawColombianColvilleComancheCosta RicanCreeCreekCroatianCrowCubanCypriotCzechCzechoslovakianDanishDelawareDominicanDutchDutch West IndianEastern EuropeanEcuadorianEgyptianEnglishEstonianEthiopianEuropeanFijianFilipinoFinnishFrenchFrench American IndianFrench CanadianGermanGerman RussianGhanaianGreekGuamanian/ChamorroGuatemalanGuyaneseHaitianHmongHonduranHopiHoumaHungarianIcelanderIndian (Asian)IndonesianInupiatIranianIraqiIrishIroquoisIsraeliItalianJamaicanJapaneseJordanianKenyanKiowaKoreanLaotianLatvianLebaneseLiberianLithuanianLumbeeLuxembourgerMacedonianMalaysianMalteseMarshalleseMenomineeMexicanMexican American IndianMongolianMoroccanNative HawaiianNavajoNepaleseNew ZealanderNicaraguanNigerianNorthern EuropeanNorwegianOkinawanOsageOttawaPaiutePakistaniPalestinianPanamanianParaguayanPennsylvania GermanPeruvianPimaPolishPortuguesePotawatomiPuebloPuerto RicanPuget Sound SalishRomanianRussianSalvadoranSamoanScandinavianScotch-IrishScottishSeminoleSenegaleseSerbianShoshoneSierra LeoneanSiouxSlavicSlovakSloveneSomaliSouth AfricanSouth AmericanSouth American IndianSoviet UnionSpaniardSpanishSpanish AmericanSpanish American IndianSri LankanSubsaharan AfricanSudaneseSwedishSwissSyrianTaiwaneseThaiTlingit-HaidaTohono O'OdhamTonganTrinidadian and TobagonianTsimshianTurkishU.S. Virgin IslanderUgandanUkrainianUruguayanUteVenezuelanVietnameseWelshWest IndianYakamaYaquiYugoslavianYumanYup'ikZimbabwean
Immigration
NonimmigrantsImmigrantsAfghanistanAfricaAlbaniaArgentinaArmeniaAsiaAustraliaAustriaBahamasBangladeshBarbadosBelarusBelgiumBelizeBoliviaBosnia and HerzegovinaBrazilBulgariaBurma/MyanmarCabo VerdeCambodiaCameroonCanadaCaribbeanCentral AmericaChileChinaColombiaCongoCosta RicaCroatiaCubaCzechoslovakiaDenmarkDominicaDominican RepublicEastern AfricaEastern AsiaEastern EuropeEcuadorEgyptEl SalvadorEnglandEritreaEthiopiaEuropeFijiFranceGermanyGhanaGreeceGrenadaGuatemalaGuyanaHaitiHondurasHong KongHungaryIndiaIndonesiaIranIraqIrelandIsraelJamaicaJapanJordanKazakhstanKenyaKoreaKuwaitLaosLatin AmericaLatviaLebanonLiberiaLithuaniaMalaysiaMexicoMicronesiaMiddle AfricaMoldovaMoroccoNepalNetherlandsNicaraguaNigeriaNorth AmericaNorth MacedoniaNorthern AfricaNorthern EuropeNorwayOceaniaPakistanPanamaPeruPhilippinesPolandPortugalRomaniaRussiaSaudi ArabiaScotlandSenegalSerbiaSierra LeoneSingaporeSomaliaSouth AfricaSouth AmericaSouth Central AsiaSouth Eastern AsiaSouthern EuropeSpainSri LankaSt. Vincent and the GrenadinesSudanSwedenSwitzerlandSyriaTaiwanThailandTrinidad and TobagoTurkeyUgandaUkraineUruguayUzbekistanVenezuelaVietnamWest IndiesWestern AfricaWestern AsiaWestern EuropeYemenZaireZimbabweAzores
Immigrants from Italy
Race
Ancestry
AfghanAfricanAlaska NativeAlaskan AthabascanAlbanianAleutAlsatianAmericanApacheArabArapahoArgentineanArmenianAssyrian/Chaldean/SyriacAustralianAustrianBahamianBangladeshiBarbadianBasqueBelgianBelizeanBermudanBhutaneseBlackfeetBolivianBrazilianBritishBritish West IndianBulgarianBurmeseCajunCambodianCanadianCape VerdeanCarpatho RusynCelticCentral AmericanCentral American IndianCherokeeCheyenneChickasawChileanChineseChippewaChoctawColombianColvilleComancheCosta RicanCreeCreekCroatianCrowCubanCypriotCzechCzechoslovakianDanishDelawareDominicanDutchDutch West IndianEastern EuropeanEcuadorianEgyptianEnglishEstonianEthiopianEuropeanFijianFilipinoFinnishFrenchFrench American IndianFrench CanadianGermanGerman RussianGhanaianGreekGuamanian/ChamorroGuatemalanGuyaneseHaitianHmongHonduranHopiHoumaHungarianIcelanderIndian (Asian)IndonesianInupiatIranianIraqiIrishIroquoisIsraeliItalianJamaicanJapaneseJordanianKenyanKiowaKoreanLaotianLatvianLebaneseLiberianLithuanianLumbeeLuxembourgerMacedonianMalaysianMalteseMarshalleseMenomineeMexicanMexican American IndianMongolianMoroccanNavajoNepaleseNew ZealanderNicaraguanNigerianNorthern EuropeanNorwegianOkinawanOsageOttawaPaiutePakistaniPalestinianPanamanianParaguayanPennsylvania GermanPeruvianPimaPolishPortuguesePotawatomiPuebloPuerto RicanPuget Sound SalishRomanianRussianSalvadoranSamoanScandinavianScotch-IrishScottishSeminoleSenegaleseSerbianShoshoneSierra LeoneanSiouxSlavicSlovakSloveneSomaliSouth AfricanSouth AmericanSouth American IndianSoviet UnionSpaniardSpanishSpanish AmericanSpanish American IndianSri LankanSubsaharan AfricanSudaneseSwedishSwissSyrianTaiwaneseThaiTlingit-HaidaTohono O'OdhamTonganTrinidadian and TobagonianTsimshianTurkishU.S. Virgin IslanderUgandanUkrainianUruguayanUteVenezuelanVietnameseWelshWest IndianYakamaYaquiYugoslavianYumanYup'ikZimbabwean
Immigration
NonimmigrantsImmigrantsAfghanistanAfricaAlbaniaArgentinaArmeniaAsiaAustraliaAustriaBahamasBangladeshBarbadosBelarusBelgiumBelizeBoliviaBosnia and HerzegovinaBrazilBulgariaBurma/MyanmarCabo VerdeCambodiaCameroonCanadaCaribbeanCentral AmericaChileChinaColombiaCongoCosta RicaCroatiaCubaCzechoslovakiaDenmarkDominicaDominican RepublicEastern AfricaEastern AsiaEastern EuropeEcuadorEgyptEl SalvadorEnglandEritreaEthiopiaEuropeFijiFranceGermanyGhanaGreeceGrenadaGuatemalaGuyanaHaitiHondurasHong KongHungaryIndiaIndonesiaIranIraqIrelandIsraelItalyJamaicaJapanJordanKazakhstanKenyaKoreaKuwaitLaosLatin AmericaLatviaLebanonLiberiaLithuaniaMalaysiaMexicoMicronesiaMiddle AfricaMoldovaMoroccoNepalNetherlandsNicaraguaNigeriaNorth AmericaNorth MacedoniaNorthern AfricaNorthern EuropeNorwayOceaniaPakistanPanamaPeruPhilippinesPolandPortugalRomaniaRussiaSaudi ArabiaScotlandSenegalSerbiaSierra LeoneSingaporeSomaliaSouth AfricaSouth AmericaSouth Central AsiaSouth Eastern AsiaSouthern EuropeSpainSri LankaSt. Vincent and the GrenadinesSudanSwedenSwitzerlandSyriaTaiwanThailandTrinidad and TobagoTurkeyUgandaUkraineUruguayUzbekistanVenezuelaVietnamWest IndiesWestern AfricaWestern AsiaWestern EuropeYemenZaireZimbabweAzores
Bachelor's Degree
Income
Poverty
Unemployment
Labor Participation
Family Structure
Vehicle Availability
Education Level
Disability

Bachelor's Degree Comparison

Native Hawaiians

Immigrants from Italy

Tragic
Exceptional
33.2%
BACHELOR'S DEGREE
0.7/ 100
METRIC RATING
254th/ 347
METRIC RANK
41.3%
BACHELOR'S DEGREE
97.8/ 100
METRIC RATING
102nd/ 347
METRIC RANK

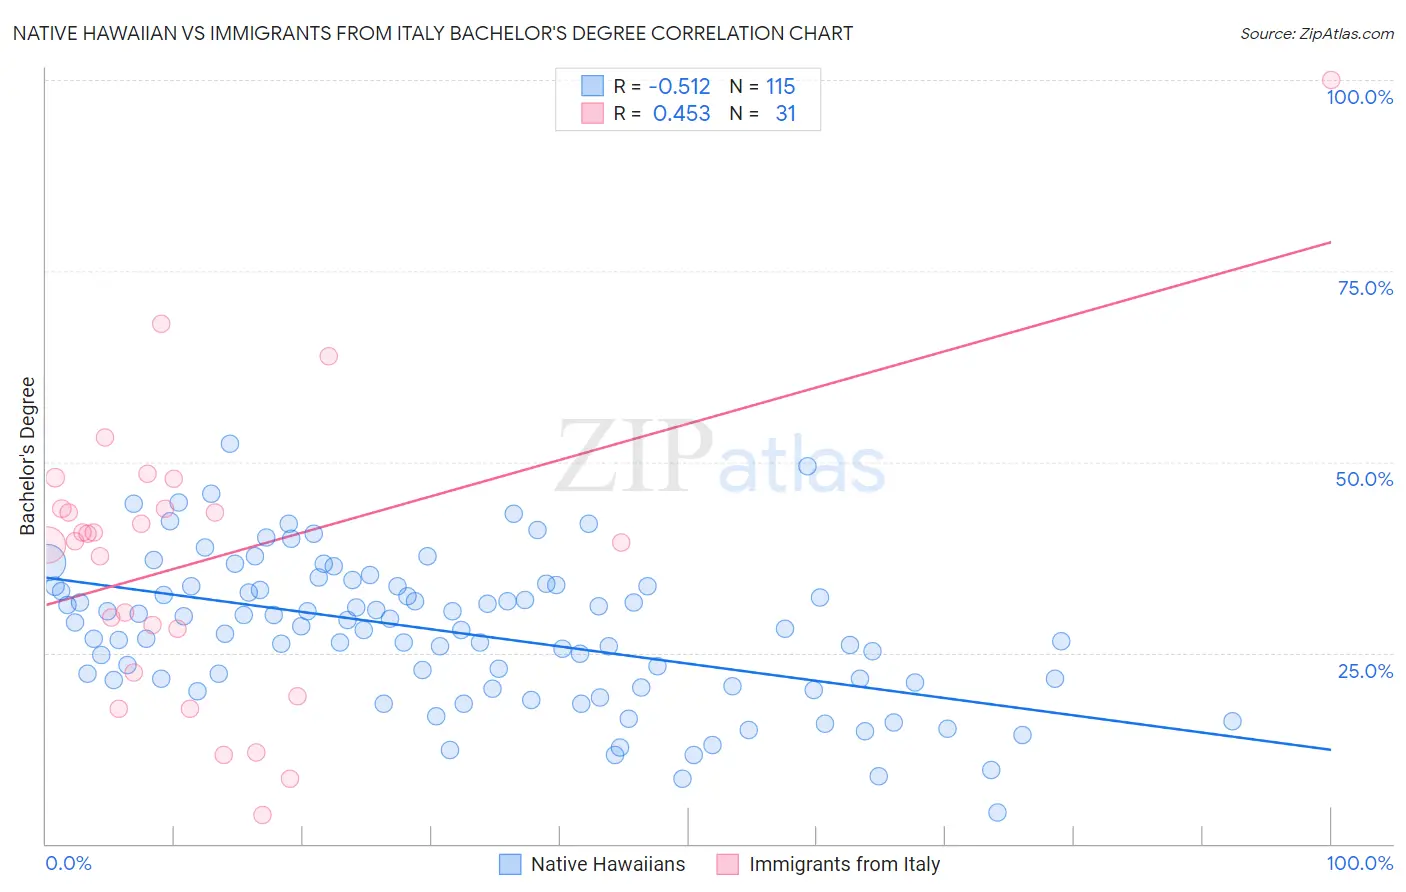
Native Hawaiian vs Immigrants from Italy Bachelor's Degree Correlation Chart

The statistical analysis conducted on geographies consisting of 332,091,621 people shows a substantial negative correlation between the proportion of Native Hawaiians and percentage of population with at least bachelor's degree education in the United States with a correlation coefficient (R) of -0.512 and weighted average of 33.2%. Similarly, the statistical analysis conducted on geographies consisting of 324,223,124 people shows a moderate positive correlation between the proportion of Immigrants from Italy and percentage of population with at least bachelor's degree education in the United States with a correlation coefficient (R) of 0.453 and weighted average of 41.3%, a difference of 24.4%.
Native Hawaiian vs Immigrants from Italy Bachelor's Degree

Bachelor's Degree Correlation Summary

MeasurementNative HawaiianImmigrants from Italy
Minimum4.0%3.7%
Maximum52.3%100.0%
Range48.3%96.3%
Mean27.7%37.2%
Median28.2%39.6%
Interquartile 25% (IQ1)21.1%22.5%
Interquartile 75% (IQ3)33.6%43.9%
Interquartile Range (IQR)12.5%21.5%
Standard Deviation (Sample)9.4%19.4%
Standard Deviation (Population)9.4%19.1%

Similar Demographics by Bachelor's Degree

Demographics Similar to Native Hawaiians by Bachelor's Degree

In terms of bachelor's degree, the demographic groups most similar to Native Hawaiians are Iroquois (33.2%, a difference of 0.020%), U.S. Virgin Islander (33.2%, a difference of 0.060%), Nicaraguan (33.1%, a difference of 0.20%), Immigrants from Bahamas (33.3%, a difference of 0.27%), and Japanese (33.3%, a difference of 0.34%).
DemographicsRating | RankBachelor's Degree
Immigrants | Congo
1.0
/100
|
#247
Tragic
33.6%
Cree
1.0
/100
|
#248
Tragic
33.6%
Immigrants | Liberia
0.9
/100
|
#249
Tragic
33.5%
Indonesians
0.9
/100
|
#250
Tragic
33.5%
Japanese
0.7
/100
|
#251
Tragic
33.3%
Immigrants | Bahamas
0.7
/100
|
#252
Tragic
33.3%
U.S. Virgin Islanders
0.7
/100
|
#253
Tragic
33.2%
Native Hawaiians
0.7
/100
|
#254
Tragic
33.2%
Iroquois
0.7
/100
|
#255
Tragic
33.2%
Nicaraguans
0.6
/100
|
#256
Tragic
33.1%
Spanish Americans
0.6
/100
|
#257
Tragic
33.1%
French American Indians
0.6
/100
|
#258
Tragic
33.1%
Osage
0.5
/100
|
#259
Tragic
33.0%
Malaysians
0.5
/100
|
#260
Tragic
32.9%
Africans
0.5
/100
|
#261
Tragic
32.9%

Demographics Similar to Immigrants from Italy by Bachelor's Degree

In terms of bachelor's degree, the demographic groups most similar to Immigrants from Italy are Immigrants from Morocco (41.4%, a difference of 0.26%), Macedonian (41.4%, a difference of 0.29%), Immigrants from England (41.4%, a difference of 0.32%), Chilean (41.2%, a difference of 0.34%), and Jordanian (41.2%, a difference of 0.40%).
DemographicsRating | RankBachelor's Degree
Immigrants | North America
98.5
/100
|
#95
Exceptional
41.7%
Immigrants | Moldova
98.4
/100
|
#96
Exceptional
41.6%
Romanians
98.4
/100
|
#97
Exceptional
41.6%
Immigrants | Ukraine
98.3
/100
|
#98
Exceptional
41.5%
Immigrants | England
98.1
/100
|
#99
Exceptional
41.4%
Macedonians
98.1
/100
|
#100
Exceptional
41.4%
Immigrants | Morocco
98.0
/100
|
#101
Exceptional
41.4%
Immigrants | Italy
97.8
/100
|
#102
Exceptional
41.3%
Chileans
97.5
/100
|
#103
Exceptional
41.2%
Jordanians
97.4
/100
|
#104
Exceptional
41.2%
Syrians
97.4
/100
|
#105
Exceptional
41.1%
Alsatians
97.0
/100
|
#106
Exceptional
41.0%
Northern Europeans
96.8
/100
|
#107
Exceptional
41.0%
Ukrainians
96.6
/100
|
#108
Exceptional
40.9%
Arabs
96.6
/100
|
#109
Exceptional
40.9%