Native Hawaiian vs Immigrants from Guatemala 7th Grade

COMPARE

Native Hawaiian
Race
Ancestry
AfghanAfricanAlaska NativeAlaskan AthabascanAlbanianAleutAlsatianAmericanApacheArabArapahoArgentineanArmenianAssyrian/Chaldean/SyriacAustralianAustrianBahamianBangladeshiBarbadianBasqueBelgianBelizeanBermudanBhutaneseBlackfeetBolivianBrazilianBritishBritish West IndianBulgarianBurmeseCajunCambodianCanadianCape VerdeanCarpatho RusynCelticCentral AmericanCentral American IndianCherokeeCheyenneChickasawChileanChineseChippewaChoctawColombianColvilleComancheCosta RicanCreeCreekCroatianCrowCubanCypriotCzechCzechoslovakianDanishDelawareDominicanDutchDutch West IndianEastern EuropeanEcuadorianEgyptianEnglishEstonianEthiopianEuropeanFijianFilipinoFinnishFrenchFrench American IndianFrench CanadianGermanGerman RussianGhanaianGreekGuamanian/ChamorroGuatemalanGuyaneseHaitianHmongHonduranHopiHoumaHungarianIcelanderIndian (Asian)IndonesianInupiatIranianIraqiIrishIroquoisIsraeliItalianJamaicanJapaneseJordanianKenyanKiowaKoreanLaotianLatvianLebaneseLiberianLithuanianLumbeeLuxembourgerMacedonianMalaysianMalteseMarshalleseMenomineeMexicanMexican American IndianMongolianMoroccanNative HawaiianNavajoNepaleseNew ZealanderNicaraguanNigerianNorthern EuropeanNorwegianOkinawanOsageOttawaPaiutePakistaniPalestinianPanamanianParaguayanPennsylvania GermanPeruvianPimaPolishPortuguesePotawatomiPuebloPuerto RicanPuget Sound SalishRomanianRussianSalvadoranSamoanScandinavianScotch-IrishScottishSeminoleSenegaleseSerbianShoshoneSierra LeoneanSiouxSlavicSlovakSloveneSomaliSouth AfricanSouth AmericanSouth American IndianSoviet UnionSpaniardSpanishSpanish AmericanSpanish American IndianSri LankanSubsaharan AfricanSudaneseSwedishSwissSyrianTaiwaneseThaiTlingit-HaidaTohono O'OdhamTonganTrinidadian and TobagonianTsimshianTurkishU.S. Virgin IslanderUgandanUkrainianUruguayanUteVenezuelanVietnameseWelshWest IndianYakamaYaquiYugoslavianYumanYup'ikZimbabwean
Immigration
NonimmigrantsImmigrantsAfghanistanAfricaAlbaniaArgentinaArmeniaAsiaAustraliaAustriaBahamasBangladeshBarbadosBelarusBelgiumBelizeBoliviaBosnia and HerzegovinaBrazilBulgariaBurma/MyanmarCabo VerdeCambodiaCameroonCanadaCaribbeanCentral AmericaChileChinaColombiaCongoCosta RicaCroatiaCubaCzechoslovakiaDenmarkDominicaDominican RepublicEastern AfricaEastern AsiaEastern EuropeEcuadorEgyptEl SalvadorEnglandEritreaEthiopiaEuropeFijiFranceGermanyGhanaGreeceGrenadaGuyanaHaitiHondurasHong KongHungaryIndiaIndonesiaIranIraqIrelandIsraelItalyJamaicaJapanJordanKazakhstanKenyaKoreaKuwaitLaosLatin AmericaLatviaLebanonLiberiaLithuaniaMalaysiaMexicoMicronesiaMiddle AfricaMoldovaMoroccoNepalNetherlandsNicaraguaNigeriaNorth AmericaNorth MacedoniaNorthern AfricaNorthern EuropeNorwayOceaniaPakistanPanamaPeruPhilippinesPolandPortugalRomaniaRussiaSaudi ArabiaScotlandSenegalSerbiaSierra LeoneSingaporeSomaliaSouth AfricaSouth AmericaSouth Central AsiaSouth Eastern AsiaSouthern EuropeSpainSri LankaSt. Vincent and the GrenadinesSudanSwedenSwitzerlandSyriaTaiwanThailandTrinidad and TobagoTurkeyUgandaUkraineUruguayUzbekistanVenezuelaVietnamWest IndiesWestern AfricaWestern AsiaWestern EuropeYemenZaireZimbabweAzores
Immigrants from Guatemala
Race
Ancestry
AfghanAfricanAlaska NativeAlaskan AthabascanAlbanianAleutAlsatianAmericanApacheArabArapahoArgentineanArmenianAssyrian/Chaldean/SyriacAustralianAustrianBahamianBangladeshiBarbadianBasqueBelgianBelizeanBermudanBhutaneseBlackfeetBolivianBrazilianBritishBritish West IndianBulgarianBurmeseCajunCambodianCanadianCape VerdeanCarpatho RusynCelticCentral AmericanCentral American IndianCherokeeCheyenneChickasawChileanChineseChippewaChoctawColombianColvilleComancheCosta RicanCreeCreekCroatianCrowCubanCypriotCzechCzechoslovakianDanishDelawareDominicanDutchDutch West IndianEastern EuropeanEcuadorianEgyptianEnglishEstonianEthiopianEuropeanFijianFilipinoFinnishFrenchFrench American IndianFrench CanadianGermanGerman RussianGhanaianGreekGuamanian/ChamorroGuatemalanGuyaneseHaitianHmongHonduranHopiHoumaHungarianIcelanderIndian (Asian)IndonesianInupiatIranianIraqiIrishIroquoisIsraeliItalianJamaicanJapaneseJordanianKenyanKiowaKoreanLaotianLatvianLebaneseLiberianLithuanianLumbeeLuxembourgerMacedonianMalaysianMalteseMarshalleseMenomineeMexicanMexican American IndianMongolianMoroccanNavajoNepaleseNew ZealanderNicaraguanNigerianNorthern EuropeanNorwegianOkinawanOsageOttawaPaiutePakistaniPalestinianPanamanianParaguayanPennsylvania GermanPeruvianPimaPolishPortuguesePotawatomiPuebloPuerto RicanPuget Sound SalishRomanianRussianSalvadoranSamoanScandinavianScotch-IrishScottishSeminoleSenegaleseSerbianShoshoneSierra LeoneanSiouxSlavicSlovakSloveneSomaliSouth AfricanSouth AmericanSouth American IndianSoviet UnionSpaniardSpanishSpanish AmericanSpanish American IndianSri LankanSubsaharan AfricanSudaneseSwedishSwissSyrianTaiwaneseThaiTlingit-HaidaTohono O'OdhamTonganTrinidadian and TobagonianTsimshianTurkishU.S. Virgin IslanderUgandanUkrainianUruguayanUteVenezuelanVietnameseWelshWest IndianYakamaYaquiYugoslavianYumanYup'ikZimbabwean
Immigration
NonimmigrantsImmigrantsAfghanistanAfricaAlbaniaArgentinaArmeniaAsiaAustraliaAustriaBahamasBangladeshBarbadosBelarusBelgiumBelizeBoliviaBosnia and HerzegovinaBrazilBulgariaBurma/MyanmarCabo VerdeCambodiaCameroonCanadaCaribbeanCentral AmericaChileChinaColombiaCongoCosta RicaCroatiaCubaCzechoslovakiaDenmarkDominicaDominican RepublicEastern AfricaEastern AsiaEastern EuropeEcuadorEgyptEl SalvadorEnglandEritreaEthiopiaEuropeFijiFranceGermanyGhanaGreeceGrenadaGuatemalaGuyanaHaitiHondurasHong KongHungaryIndiaIndonesiaIranIraqIrelandIsraelItalyJamaicaJapanJordanKazakhstanKenyaKoreaKuwaitLaosLatin AmericaLatviaLebanonLiberiaLithuaniaMalaysiaMexicoMicronesiaMiddle AfricaMoldovaMoroccoNepalNetherlandsNicaraguaNigeriaNorth AmericaNorth MacedoniaNorthern AfricaNorthern EuropeNorwayOceaniaPakistanPanamaPeruPhilippinesPolandPortugalRomaniaRussiaSaudi ArabiaScotlandSenegalSerbiaSierra LeoneSingaporeSomaliaSouth AfricaSouth AmericaSouth Central AsiaSouth Eastern AsiaSouthern EuropeSpainSri LankaSt. Vincent and the GrenadinesSudanSwedenSwitzerlandSyriaTaiwanThailandTrinidad and TobagoTurkeyUgandaUkraineUruguayUzbekistanVenezuelaVietnamWest IndiesWestern AfricaWestern AsiaWestern EuropeYemenZaireZimbabweAzores
7th Grade
Income
Poverty
Unemployment
Labor Participation
Family Structure
Vehicle Availability
Education Level
Disability

7th Grade Comparison

Native Hawaiians

Immigrants from Guatemala

Exceptional
Tragic
96.9%
7TH GRADE
99.7/ 100
METRIC RATING
67th/ 347
METRIC RANK
91.3%
7TH GRADE
0.0/ 100
METRIC RATING
343rd/ 347
METRIC RANK

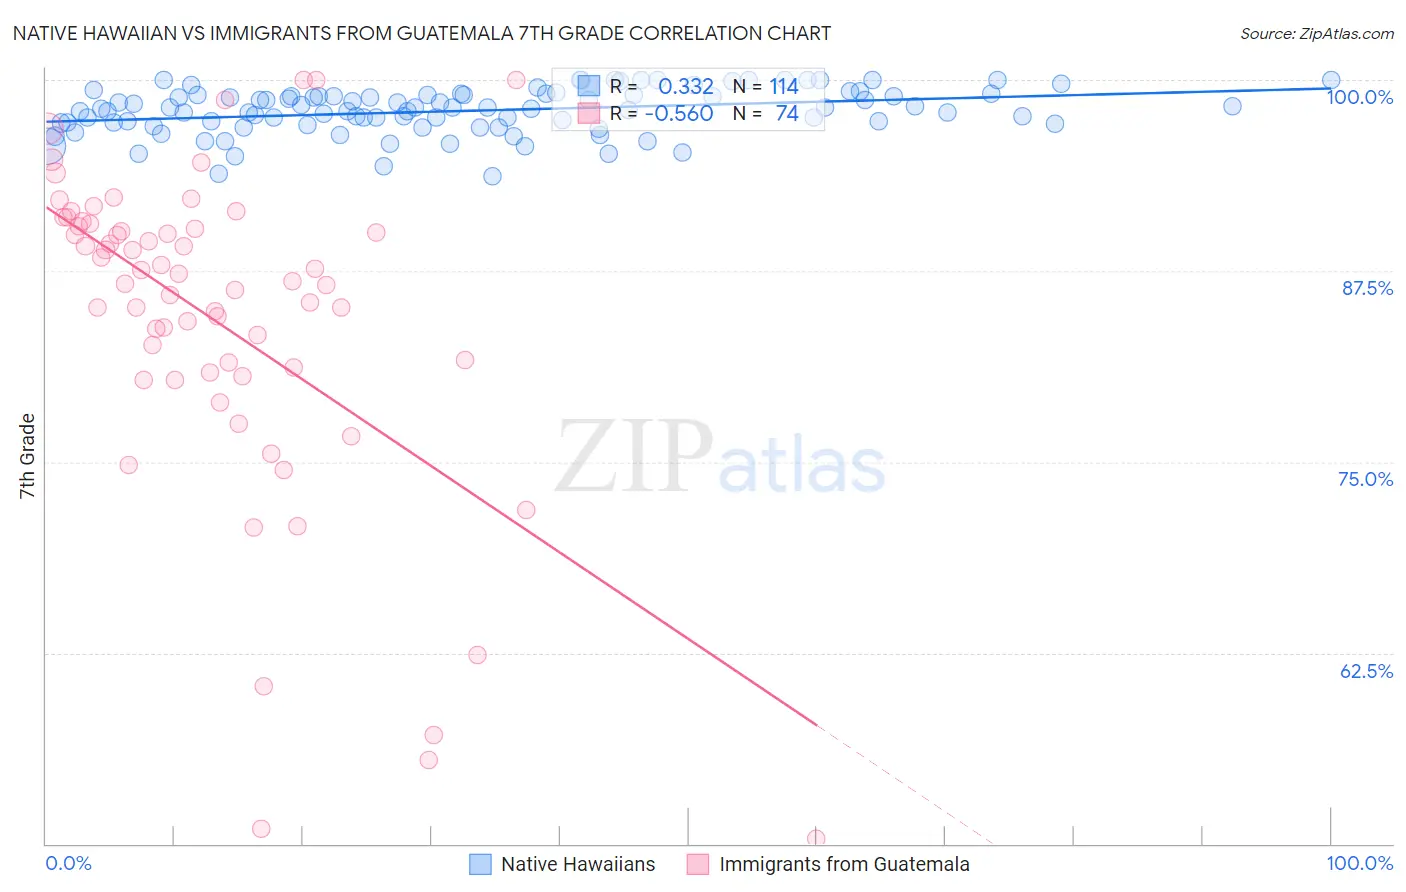
Native Hawaiian vs Immigrants from Guatemala 7th Grade Correlation Chart

The statistical analysis conducted on geographies consisting of 332,101,429 people shows a mild positive correlation between the proportion of Native Hawaiians and percentage of population with at least 7th grade education in the United States with a correlation coefficient (R) of 0.332 and weighted average of 96.9%. Similarly, the statistical analysis conducted on geographies consisting of 377,286,142 people shows a substantial negative correlation between the proportion of Immigrants from Guatemala and percentage of population with at least 7th grade education in the United States with a correlation coefficient (R) of -0.560 and weighted average of 91.3%, a difference of 6.1%.
Native Hawaiian vs Immigrants from Guatemala 7th Grade

7th Grade Correlation Summary

MeasurementNative HawaiianImmigrants from Guatemala
Minimum93.7%50.3%
Maximum100.0%100.0%
Range6.3%49.7%
Mean98.0%84.2%
Median98.2%86.7%
Interquartile 25% (IQ1)97.2%80.8%
Interquartile 75% (IQ3)99.0%90.5%
Interquartile Range (IQR)1.8%9.6%
Standard Deviation (Sample)1.5%10.7%
Standard Deviation (Population)1.5%10.6%

Similar Demographics by 7th Grade

Demographics Similar to Native Hawaiians by 7th Grade

In terms of 7th grade, the demographic groups most similar to Native Hawaiians are Ukrainian (96.9%, a difference of 0.0%), Immigrants from Austria (96.9%, a difference of 0.020%), Canadian (96.9%, a difference of 0.020%), Immigrants from India (96.9%, a difference of 0.020%), and Immigrants from Northern Europe (96.9%, a difference of 0.030%).
DemographicsRating | Rank7th Grade
Immigrants | Canada
99.8
/100
|
#60
Exceptional
96.9%
Creek
99.8
/100
|
#61
Exceptional
96.9%
Immigrants | North America
99.8
/100
|
#62
Exceptional
96.9%
Immigrants | Northern Europe
99.7
/100
|
#63
Exceptional
96.9%
Immigrants | Austria
99.7
/100
|
#64
Exceptional
96.9%
Canadians
99.7
/100
|
#65
Exceptional
96.9%
Ukrainians
99.7
/100
|
#66
Exceptional
96.9%
Native Hawaiians
99.7
/100
|
#67
Exceptional
96.9%
Immigrants | India
99.6
/100
|
#68
Exceptional
96.9%
Iranians
99.6
/100
|
#69
Exceptional
96.8%
New Zealanders
99.6
/100
|
#70
Exceptional
96.8%
Immigrants | Lithuania
99.6
/100
|
#71
Exceptional
96.8%
Cajuns
99.5
/100
|
#72
Exceptional
96.8%
Arapaho
99.5
/100
|
#73
Exceptional
96.8%
Immigrants | England
99.5
/100
|
#74
Exceptional
96.8%

Demographics Similar to Immigrants from Guatemala by 7th Grade

In terms of 7th grade, the demographic groups most similar to Immigrants from Guatemala are Salvadoran (91.5%, a difference of 0.16%), Immigrants from Central America (91.0%, a difference of 0.36%), Guatemalan (91.7%, a difference of 0.43%), Immigrants from El Salvador (90.9%, a difference of 0.43%), and Yakama (91.7%, a difference of 0.45%).
DemographicsRating | Rank7th Grade
Immigrants | Armenia
0.0
/100
|
#333
Tragic
92.7%
Immigrants | Yemen
0.0
/100
|
#334
Tragic
92.6%
Mexican American Indians
0.0
/100
|
#335
Tragic
92.6%
Immigrants | Honduras
0.0
/100
|
#336
Tragic
92.5%
Immigrants | Latin America
0.0
/100
|
#337
Tragic
92.2%
Central Americans
0.0
/100
|
#338
Tragic
92.1%
Mexicans
0.0
/100
|
#339
Tragic
91.9%
Yakama
0.0
/100
|
#340
Tragic
91.7%
Guatemalans
0.0
/100
|
#341
Tragic
91.7%
Salvadorans
0.0
/100
|
#342
Tragic
91.5%
Immigrants | Guatemala
0.0
/100
|
#343
Tragic
91.3%
Immigrants | Central America
0.0
/100
|
#344
Tragic
91.0%
Immigrants | El Salvador
0.0
/100
|
#345
Tragic
90.9%
Immigrants | Mexico
0.0
/100
|
#346
Tragic
90.7%
Spanish American Indians
0.0
/100
|
#347
Tragic
90.3%