Mongolian vs Tongan Associate's Degree
COMPARE
Mongolian
Tongan
Associate's Degree
Associate's Degree Comparison
Mongolians
Tongans
53.0%
ASSOCIATE'S DEGREE
100.0/ 100
METRIC RATING
38th/ 347
METRIC RANK
43.0%
ASSOCIATE'S DEGREE
2.2/ 100
METRIC RATING
233rd/ 347
METRIC RANK
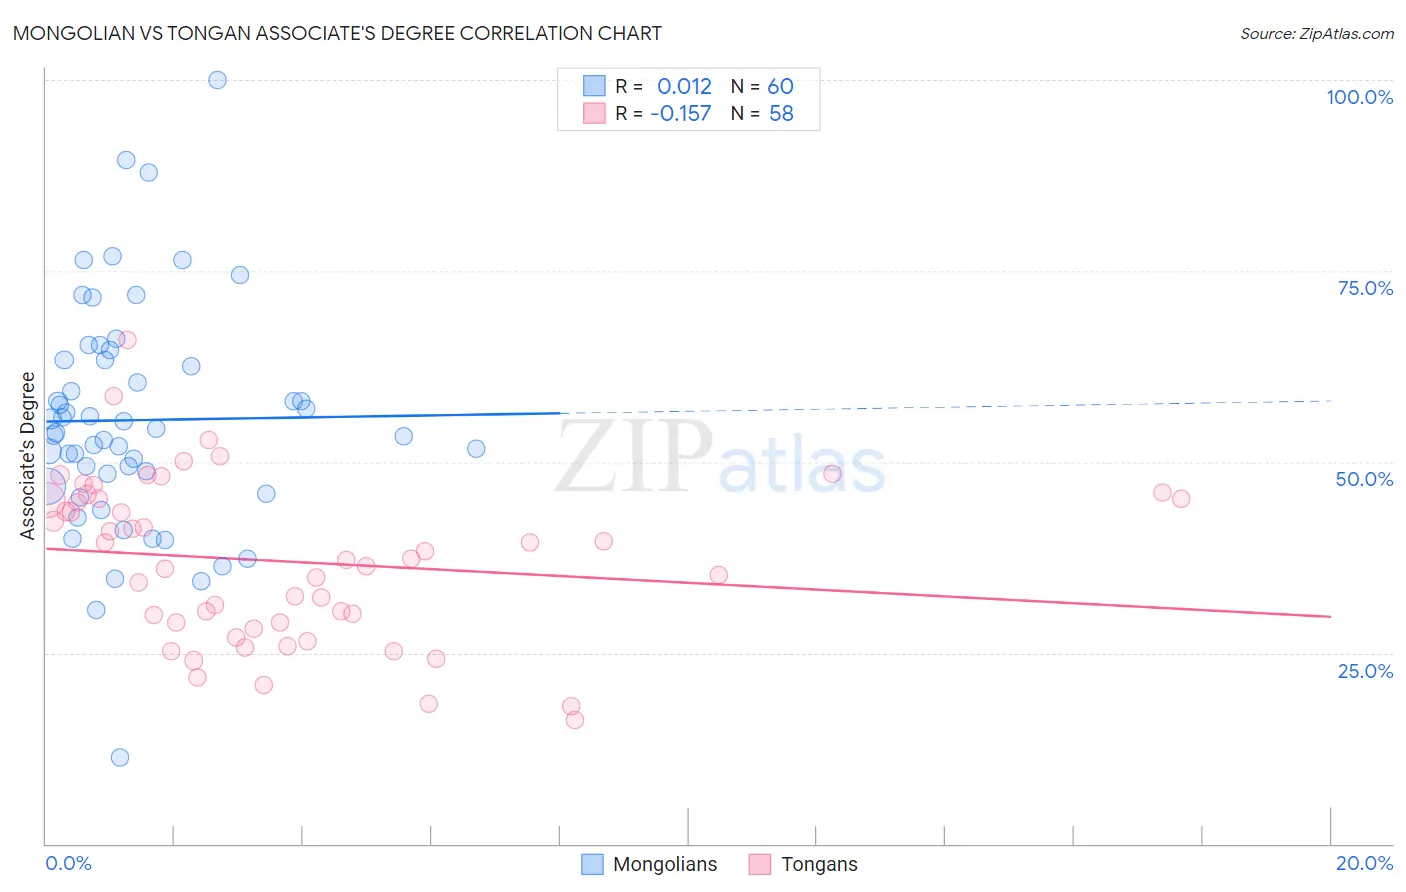
Mongolian vs Tongan Associate's Degree Correlation Chart
The statistical analysis conducted on geographies consisting of 140,359,763 people shows no correlation between the proportion of Mongolians and percentage of population with at least associate's degree education in the United States with a correlation coefficient (R) of 0.012 and weighted average of 53.0%. Similarly, the statistical analysis conducted on geographies consisting of 102,908,759 people shows a poor negative correlation between the proportion of Tongans and percentage of population with at least associate's degree education in the United States with a correlation coefficient (R) of -0.157 and weighted average of 43.0%, a difference of 23.0%.
Associate's Degree Correlation Summary
| Measurement | Mongolian | Tongan |
| Minimum | 11.2% | 16.2% |
| Maximum | 100.0% | 65.9% |
| Range | 88.8% | 49.7% |
| Mean | 55.5% | 37.0% |
| Median | 54.1% | 37.2% |
| Interquartile 25% (IQ1) | 47.6% | 28.9% |
| Interquartile 75% (IQ3) | 63.3% | 45.1% |
| Interquartile Range (IQR) | 15.7% | 16.2% |
| Standard Deviation (Sample) | 15.0% | 10.6% |
| Standard Deviation (Population) | 14.9% | 10.5% |
Similar Demographics by Associate's Degree
Demographics Similar to Mongolians by Associate's Degree
In terms of associate's degree, the demographic groups most similar to Mongolians are Immigrants from Denmark (53.1%, a difference of 0.16%), Immigrants from Russia (53.1%, a difference of 0.25%), Immigrants from Belarus (52.8%, a difference of 0.29%), Immigrants from Latvia (52.8%, a difference of 0.36%), and Russian (53.2%, a difference of 0.53%).
| Demographics | Rating | Rank | Associate's Degree |
| Immigrants | Northern Europe | 100.0 /100 | #31 | Exceptional 53.5% |
| Immigrants | Turkey | 100.0 /100 | #32 | Exceptional 53.4% |
| Israelis | 100.0 /100 | #33 | Exceptional 53.4% |
| Bulgarians | 100.0 /100 | #34 | Exceptional 53.3% |
| Russians | 100.0 /100 | #35 | Exceptional 53.2% |
| Immigrants | Russia | 100.0 /100 | #36 | Exceptional 53.1% |
| Immigrants | Denmark | 100.0 /100 | #37 | Exceptional 53.1% |
| Mongolians | 100.0 /100 | #38 | Exceptional 53.0% |
| Immigrants | Belarus | 99.9 /100 | #39 | Exceptional 52.8% |
| Immigrants | Latvia | 99.9 /100 | #40 | Exceptional 52.8% |
| Immigrants | Saudi Arabia | 99.9 /100 | #41 | Exceptional 52.6% |
| Immigrants | Malaysia | 99.9 /100 | #42 | Exceptional 52.5% |
| Immigrants | South Africa | 99.9 /100 | #43 | Exceptional 52.5% |
| Estonians | 99.9 /100 | #44 | Exceptional 52.5% |
| Immigrants | Lithuania | 99.9 /100 | #45 | Exceptional 52.4% |
Demographics Similar to Tongans by Associate's Degree
In terms of associate's degree, the demographic groups most similar to Tongans are Tlingit-Haida (43.0%, a difference of 0.090%), Native Hawaiian (43.1%, a difference of 0.16%), Ecuadorian (43.0%, a difference of 0.19%), Immigrants from St. Vincent and the Grenadines (42.9%, a difference of 0.27%), and Nonimmigrants (42.9%, a difference of 0.29%).
| Demographics | Rating | Rank | Associate's Degree |
| Immigrants | Burma/Myanmar | 4.3 /100 | #226 | Tragic 43.7% |
| Trinidadians and Tobagonians | 4.0 /100 | #227 | Tragic 43.6% |
| Hmong | 3.2 /100 | #228 | Tragic 43.4% |
| Immigrants | Trinidad and Tobago | 3.0 /100 | #229 | Tragic 43.3% |
| Immigrants | Barbados | 2.9 /100 | #230 | Tragic 43.3% |
| Liberians | 2.9 /100 | #231 | Tragic 43.3% |
| Native Hawaiians | 2.3 /100 | #232 | Tragic 43.1% |
| Tongans | 2.2 /100 | #233 | Tragic 43.0% |
| Tlingit-Haida | 2.1 /100 | #234 | Tragic 43.0% |
| Ecuadorians | 2.0 /100 | #235 | Tragic 43.0% |
| Immigrants | St. Vincent and the Grenadines | 1.9 /100 | #236 | Tragic 42.9% |
| Immigrants | Nonimmigrants | 1.9 /100 | #237 | Tragic 42.9% |
| Iroquois | 1.7 /100 | #238 | Tragic 42.8% |
| Immigrants | Grenada | 1.3 /100 | #239 | Tragic 42.6% |
| Cree | 1.2 /100 | #240 | Tragic 42.5% |