Mexican vs Norwegian 11th Grade
COMPARE
Mexican
Norwegian
11th Grade
11th Grade Comparison
Mexicans
Norwegians
86.1%
11TH GRADE
0.0/ 100
METRIC RATING
341st/ 347
METRIC RANK
95.2%
11TH GRADE
100.0/ 100
METRIC RATING
1st/ 347
METRIC RANK
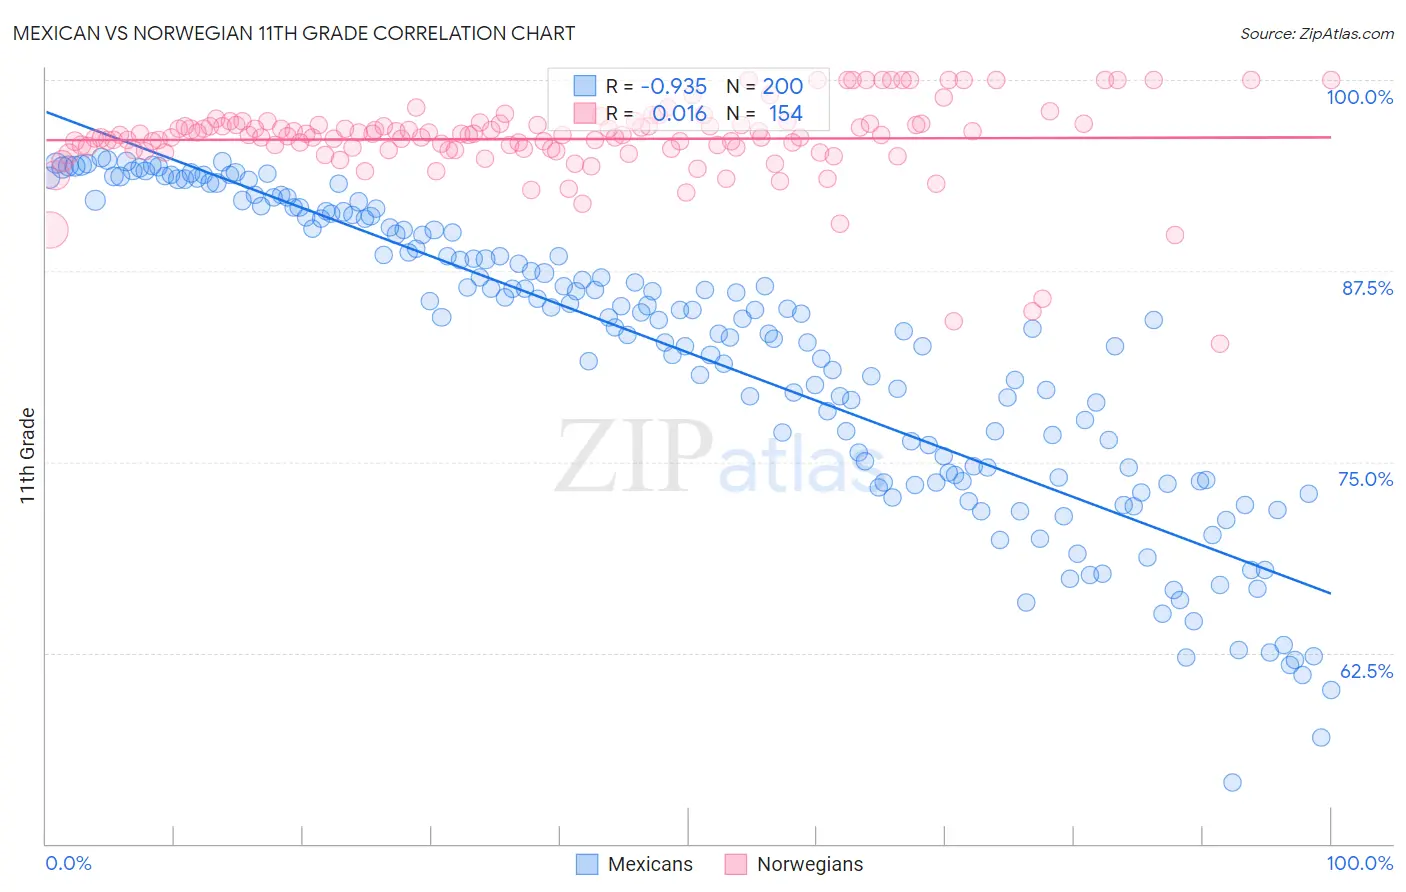
Mexican vs Norwegian 11th Grade Correlation Chart
The statistical analysis conducted on geographies consisting of 565,338,951 people shows a near-perfect negative correlation between the proportion of Mexicans and percentage of population with at least 11th grade education in the United States with a correlation coefficient (R) of -0.935 and weighted average of 86.1%. Similarly, the statistical analysis conducted on geographies consisting of 533,395,805 people shows no correlation between the proportion of Norwegians and percentage of population with at least 11th grade education in the United States with a correlation coefficient (R) of 0.016 and weighted average of 95.2%, a difference of 10.6%.
11th Grade Correlation Summary
| Measurement | Mexican | Norwegian |
| Minimum | 54.0% | 82.8% |
| Maximum | 94.9% | 100.0% |
| Range | 40.9% | 17.2% |
| Mean | 82.1% | 96.1% |
| Median | 84.4% | 96.4% |
| Interquartile 25% (IQ1) | 74.2% | 95.5% |
| Interquartile 75% (IQ3) | 90.9% | 97.1% |
| Interquartile Range (IQR) | 16.7% | 1.6% |
| Standard Deviation (Sample) | 9.8% | 2.7% |
| Standard Deviation (Population) | 9.7% | 2.7% |
Similar Demographics by 11th Grade
Demographics Similar to Mexicans by 11th Grade
In terms of 11th grade, the demographic groups most similar to Mexicans are Salvadoran (86.2%, a difference of 0.060%), Guatemalan (86.4%, a difference of 0.29%), Immigrants from Guatemala (85.8%, a difference of 0.33%), Immigrants from Latin America (86.8%, a difference of 0.78%), and Immigrants from Dominican Republic (86.9%, a difference of 0.91%).
| Demographics | Rating | Rank | 11th Grade |
| Immigrants | Yemen | 0.0 /100 | #333 | Tragic 87.1% |
| Houma | 0.0 /100 | #334 | Tragic 87.0% |
| Central Americans | 0.0 /100 | #335 | Tragic 86.9% |
| Immigrants | Dominican Republic | 0.0 /100 | #336 | Tragic 86.9% |
| Immigrants | Honduras | 0.0 /100 | #337 | Tragic 86.9% |
| Immigrants | Latin America | 0.0 /100 | #338 | Tragic 86.8% |
| Guatemalans | 0.0 /100 | #339 | Tragic 86.4% |
| Salvadorans | 0.0 /100 | #340 | Tragic 86.2% |
| Mexicans | 0.0 /100 | #341 | Tragic 86.1% |
| Immigrants | Guatemala | 0.0 /100 | #342 | Tragic 85.8% |
| Immigrants | El Salvador | 0.0 /100 | #343 | Tragic 85.3% |
| Yakama | 0.0 /100 | #344 | Tragic 85.0% |
| Immigrants | Central America | 0.0 /100 | #345 | Tragic 84.9% |
| Spanish American Indians | 0.0 /100 | #346 | Tragic 84.7% |
| Immigrants | Mexico | 0.0 /100 | #347 | Tragic 84.5% |
Demographics Similar to Norwegians by 11th Grade
In terms of 11th grade, the demographic groups most similar to Norwegians are Swedish (94.9%, a difference of 0.28%), Slovene (94.9%, a difference of 0.30%), Slovak (94.9%, a difference of 0.32%), Carpatho Rusyn (94.8%, a difference of 0.38%), and Lithuanian (94.8%, a difference of 0.43%).
| Demographics | Rating | Rank | 11th Grade |
| Norwegians | 100.0 /100 | #1 | Exceptional 95.2% |
| Swedes | 100.0 /100 | #2 | Exceptional 94.9% |
| Slovenes | 100.0 /100 | #3 | Exceptional 94.9% |
| Slovaks | 100.0 /100 | #4 | Exceptional 94.9% |
| Carpatho Rusyns | 100.0 /100 | #5 | Exceptional 94.8% |
| Lithuanians | 100.0 /100 | #6 | Exceptional 94.8% |
| Poles | 100.0 /100 | #7 | Exceptional 94.8% |
| Croatians | 100.0 /100 | #8 | Exceptional 94.7% |
| Danes | 100.0 /100 | #9 | Exceptional 94.7% |
| Finns | 100.0 /100 | #10 | Exceptional 94.7% |
| Germans | 100.0 /100 | #11 | Exceptional 94.7% |
| Latvians | 100.0 /100 | #12 | Exceptional 94.7% |
| Chinese | 100.0 /100 | #13 | Exceptional 94.6% |
| Eastern Europeans | 100.0 /100 | #14 | Exceptional 94.6% |
| Bulgarians | 100.0 /100 | #15 | Exceptional 94.5% |