Marshallese vs Immigrants from St. Vincent and the Grenadines 1st Grade

COMPARE

Marshallese
Race
Ancestry
AfghanAfricanAlaska NativeAlaskan AthabascanAlbanianAleutAlsatianAmericanApacheArabArapahoArgentineanArmenianAssyrian/Chaldean/SyriacAustralianAustrianBahamianBangladeshiBarbadianBasqueBelgianBelizeanBermudanBhutaneseBlackfeetBolivianBrazilianBritishBritish West IndianBulgarianBurmeseCajunCambodianCanadianCape VerdeanCarpatho RusynCelticCentral AmericanCentral American IndianCherokeeCheyenneChickasawChileanChineseChippewaChoctawColombianColvilleComancheCosta RicanCreeCreekCroatianCrowCubanCypriotCzechCzechoslovakianDanishDelawareDominicanDutchDutch West IndianEastern EuropeanEcuadorianEgyptianEnglishEstonianEthiopianEuropeanFijianFilipinoFinnishFrenchFrench American IndianFrench CanadianGermanGerman RussianGhanaianGreekGuamanian/ChamorroGuatemalanGuyaneseHaitianHmongHonduranHopiHoumaHungarianIcelanderIndian (Asian)IndonesianInupiatIranianIraqiIrishIroquoisIsraeliItalianJamaicanJapaneseJordanianKenyanKiowaKoreanLaotianLatvianLebaneseLiberianLithuanianLumbeeLuxembourgerMacedonianMalaysianMalteseMarshalleseMenomineeMexicanMexican American IndianMongolianMoroccanNative HawaiianNavajoNepaleseNew ZealanderNicaraguanNigerianNorthern EuropeanNorwegianOkinawanOsageOttawaPaiutePakistaniPalestinianPanamanianParaguayanPennsylvania GermanPeruvianPimaPolishPortuguesePotawatomiPuebloPuerto RicanPuget Sound SalishRomanianRussianSalvadoranSamoanScandinavianScotch-IrishScottishSeminoleSenegaleseSerbianShoshoneSierra LeoneanSiouxSlavicSlovakSloveneSomaliSouth AfricanSouth AmericanSouth American IndianSoviet UnionSpaniardSpanishSpanish AmericanSpanish American IndianSri LankanSubsaharan AfricanSudaneseSwedishSwissSyrianTaiwaneseThaiTlingit-HaidaTohono O'OdhamTonganTrinidadian and TobagonianTsimshianTurkishU.S. Virgin IslanderUgandanUkrainianUruguayanUteVenezuelanVietnameseWelshWest IndianYakamaYaquiYugoslavianYumanYup'ikZimbabwean
Immigration
NonimmigrantsImmigrantsAfghanistanAfricaAlbaniaArgentinaArmeniaAsiaAustraliaAustriaBahamasBangladeshBarbadosBelarusBelgiumBelizeBoliviaBosnia and HerzegovinaBrazilBulgariaBurma/MyanmarCabo VerdeCambodiaCameroonCanadaCaribbeanCentral AmericaChileChinaColombiaCongoCosta RicaCroatiaCubaCzechoslovakiaDenmarkDominicaDominican RepublicEastern AfricaEastern AsiaEastern EuropeEcuadorEgyptEl SalvadorEnglandEritreaEthiopiaEuropeFijiFranceGermanyGhanaGreeceGrenadaGuatemalaGuyanaHaitiHondurasHong KongHungaryIndiaIndonesiaIranIraqIrelandIsraelItalyJamaicaJapanJordanKazakhstanKenyaKoreaKuwaitLaosLatin AmericaLatviaLebanonLiberiaLithuaniaMalaysiaMexicoMicronesiaMiddle AfricaMoldovaMoroccoNepalNetherlandsNicaraguaNigeriaNorth AmericaNorth MacedoniaNorthern AfricaNorthern EuropeNorwayOceaniaPakistanPanamaPeruPhilippinesPolandPortugalRomaniaRussiaSaudi ArabiaScotlandSenegalSerbiaSierra LeoneSingaporeSomaliaSouth AfricaSouth AmericaSouth Central AsiaSouth Eastern AsiaSouthern EuropeSpainSri LankaSudanSwedenSwitzerlandSyriaTaiwanThailandTrinidad and TobagoTurkeyUgandaUkraineUruguayUzbekistanVenezuelaVietnamWest IndiesWestern AfricaWestern AsiaWestern EuropeYemenZaireZimbabweAzores
Immigrants from St. Vincent and the Grenadines
Race
Ancestry
AfghanAfricanAlaska NativeAlaskan AthabascanAlbanianAleutAlsatianAmericanApacheArabArapahoArgentineanArmenianAssyrian/Chaldean/SyriacAustralianAustrianBahamianBangladeshiBarbadianBasqueBelgianBelizeanBermudanBhutaneseBlackfeetBolivianBrazilianBritishBritish West IndianBulgarianBurmeseCajunCambodianCanadianCape VerdeanCarpatho RusynCelticCentral AmericanCentral American IndianCherokeeCheyenneChickasawChileanChineseChippewaChoctawColombianColvilleComancheCosta RicanCreeCreekCroatianCrowCubanCypriotCzechCzechoslovakianDanishDelawareDominicanDutchDutch West IndianEastern EuropeanEcuadorianEgyptianEnglishEstonianEthiopianEuropeanFijianFilipinoFinnishFrenchFrench American IndianFrench CanadianGermanGerman RussianGhanaianGreekGuamanian/ChamorroGuatemalanGuyaneseHaitianHmongHonduranHopiHoumaHungarianIcelanderIndian (Asian)IndonesianInupiatIranianIraqiIrishIroquoisIsraeliItalianJamaicanJapaneseJordanianKenyanKiowaKoreanLaotianLatvianLebaneseLiberianLithuanianLumbeeLuxembourgerMacedonianMalaysianMalteseMenomineeMexicanMexican American IndianMongolianMoroccanNative HawaiianNavajoNepaleseNew ZealanderNicaraguanNigerianNorthern EuropeanNorwegianOkinawanOsageOttawaPaiutePakistaniPalestinianPanamanianParaguayanPennsylvania GermanPeruvianPimaPolishPortuguesePotawatomiPuebloPuerto RicanPuget Sound SalishRomanianRussianSalvadoranSamoanScandinavianScotch-IrishScottishSeminoleSenegaleseSerbianShoshoneSierra LeoneanSiouxSlavicSlovakSloveneSomaliSouth AfricanSouth AmericanSouth American IndianSoviet UnionSpaniardSpanishSpanish AmericanSpanish American IndianSri LankanSubsaharan AfricanSudaneseSwedishSwissSyrianTaiwaneseThaiTlingit-HaidaTohono O'OdhamTonganTrinidadian and TobagonianTsimshianTurkishU.S. Virgin IslanderUgandanUkrainianUruguayanUteVenezuelanVietnameseWelshWest IndianYakamaYaquiYugoslavianYumanYup'ikZimbabwean
Immigration
NonimmigrantsImmigrantsAfghanistanAfricaAlbaniaArgentinaArmeniaAsiaAustraliaAustriaBahamasBangladeshBarbadosBelarusBelgiumBelizeBoliviaBosnia and HerzegovinaBrazilBulgariaBurma/MyanmarCabo VerdeCambodiaCameroonCanadaCaribbeanCentral AmericaChileChinaColombiaCongoCosta RicaCroatiaCubaCzechoslovakiaDenmarkDominicaDominican RepublicEastern AfricaEastern AsiaEastern EuropeEcuadorEgyptEl SalvadorEnglandEritreaEthiopiaEuropeFijiFranceGermanyGhanaGreeceGrenadaGuatemalaGuyanaHaitiHondurasHong KongHungaryIndiaIndonesiaIranIraqIrelandIsraelItalyJamaicaJapanJordanKazakhstanKenyaKoreaKuwaitLaosLatin AmericaLatviaLebanonLiberiaLithuaniaMalaysiaMexicoMicronesiaMiddle AfricaMoldovaMoroccoNepalNetherlandsNicaraguaNigeriaNorth AmericaNorth MacedoniaNorthern AfricaNorthern EuropeNorwayOceaniaPakistanPanamaPeruPhilippinesPolandPortugalRomaniaRussiaSaudi ArabiaScotlandSenegalSerbiaSierra LeoneSingaporeSomaliaSouth AfricaSouth AmericaSouth Central AsiaSouth Eastern AsiaSouthern EuropeSpainSri LankaSt. Vincent and the GrenadinesSudanSwedenSwitzerlandSyriaTaiwanThailandTrinidad and TobagoTurkeyUgandaUkraineUruguayUzbekistanVenezuelaVietnamWest IndiesWestern AfricaWestern AsiaWestern EuropeYemenZaireZimbabweAzores
1st Grade
Income
Poverty
Unemployment
Labor Participation
Family Structure
Vehicle Availability
Education Level
Disability

1st Grade Comparison

Marshallese

Immigrants from St. Vincent and the Grenadines

Excellent
Tragic
98.0%
1ST GRADE
82.0/ 100
METRIC RATING
142nd/ 347
METRIC RANK
97.3%
1ST GRADE
0.0/ 100
METRIC RATING
290th/ 347
METRIC RANK

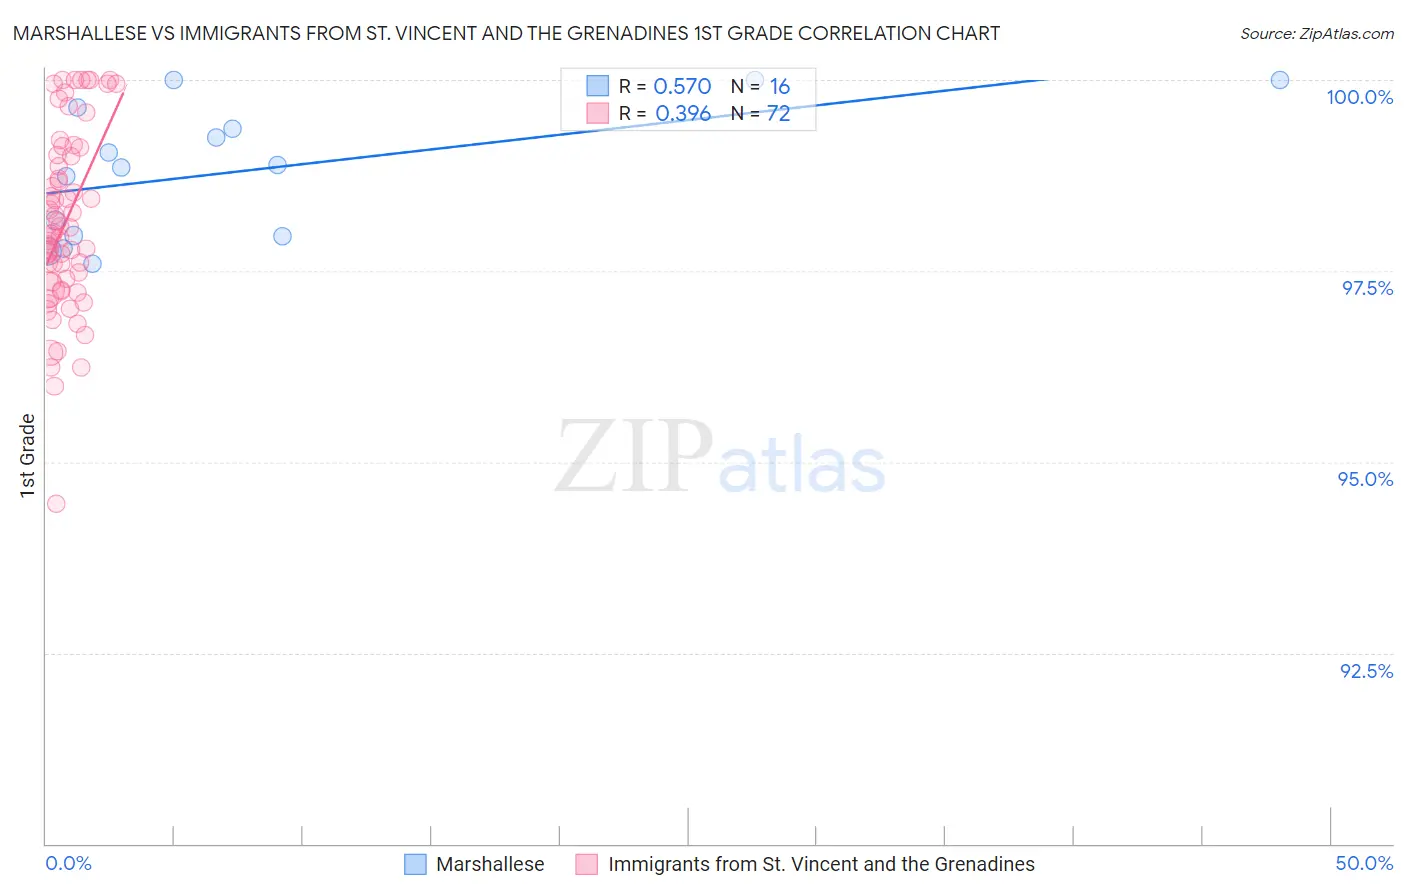
Marshallese vs Immigrants from St. Vincent and the Grenadines 1st Grade Correlation Chart

The statistical analysis conducted on geographies consisting of 14,761,315 people shows a substantial positive correlation between the proportion of Marshallese and percentage of population with at least 1st grade education in the United States with a correlation coefficient (R) of 0.570 and weighted average of 98.0%. Similarly, the statistical analysis conducted on geographies consisting of 56,176,062 people shows a mild positive correlation between the proportion of Immigrants from St. Vincent and the Grenadines and percentage of population with at least 1st grade education in the United States with a correlation coefficient (R) of 0.396 and weighted average of 97.3%, a difference of 0.81%.
Marshallese vs Immigrants from St. Vincent and the Grenadines 1st Grade

1st Grade Correlation Summary

MeasurementMarshalleseImmigrants from St. Vincent and the Grenadines
Minimum97.6%94.4%
Maximum100.0%100.0%
Range2.4%5.6%
Mean98.8%98.1%
Median98.9%98.0%
Interquartile 25% (IQ1)98.0%97.3%
Interquartile 75% (IQ3)99.5%99.0%
Interquartile Range (IQR)1.5%1.7%
Standard Deviation (Sample)0.86%1.2%
Standard Deviation (Population)0.83%1.2%

Similar Demographics by 1st Grade

Demographics Similar to Marshallese by 1st Grade

In terms of 1st grade, the demographic groups most similar to Marshallese are Immigrants from Turkey (98.0%, a difference of 0.0%), Palestinian (98.0%, a difference of 0.010%), Burmese (98.0%, a difference of 0.010%), Alsatian (98.0%, a difference of 0.010%), and Hmong (98.0%, a difference of 0.010%).
DemographicsRating | Rank1st Grade
Immigrants | Kuwait
89.3
/100
|
#135
Excellent
98.1%
Immigrants | Bulgaria
88.8
/100
|
#136
Excellent
98.1%
Israelis
87.8
/100
|
#137
Excellent
98.1%
Immigrants | Romania
87.8
/100
|
#138
Excellent
98.1%
Blackfeet
87.6
/100
|
#139
Excellent
98.1%
Palestinians
83.0
/100
|
#140
Excellent
98.0%
Immigrants | Turkey
82.8
/100
|
#141
Excellent
98.0%
Marshallese
82.0
/100
|
#142
Excellent
98.0%
Burmese
81.0
/100
|
#143
Excellent
98.0%
Alsatians
80.9
/100
|
#144
Excellent
98.0%
Hmong
79.0
/100
|
#145
Good
98.0%
Immigrants | Israel
77.8
/100
|
#146
Good
98.0%
Filipinos
77.6
/100
|
#147
Good
98.0%
Apache
75.2
/100
|
#148
Good
98.0%
Immigrants | Greece
74.9
/100
|
#149
Good
98.0%

Demographics Similar to Immigrants from St. Vincent and the Grenadines by 1st Grade

In terms of 1st grade, the demographic groups most similar to Immigrants from St. Vincent and the Grenadines are Immigrants from Afghanistan (97.3%, a difference of 0.0%), Houma (97.2%, a difference of 0.020%), Immigrants from Hong Kong (97.3%, a difference of 0.030%), Immigrants from Thailand (97.3%, a difference of 0.030%), and British West Indian (97.2%, a difference of 0.030%).
DemographicsRating | Rank1st Grade
Immigrants | West Indies
0.0
/100
|
#283
Tragic
97.3%
Immigrants | Trinidad and Tobago
0.0
/100
|
#284
Tragic
97.3%
Immigrants | Portugal
0.0
/100
|
#285
Tragic
97.3%
Immigrants | Barbados
0.0
/100
|
#286
Tragic
97.3%
Immigrants | Hong Kong
0.0
/100
|
#287
Tragic
97.3%
Immigrants | Thailand
0.0
/100
|
#288
Tragic
97.3%
Immigrants | Afghanistan
0.0
/100
|
#289
Tragic
97.3%
Immigrants | St. Vincent and the Grenadines
0.0
/100
|
#290
Tragic
97.3%
Houma
0.0
/100
|
#291
Tragic
97.2%
British West Indians
0.0
/100
|
#292
Tragic
97.2%
Malaysians
0.0
/100
|
#293
Tragic
97.2%
Immigrants | Grenada
0.0
/100
|
#294
Tragic
97.2%
Immigrants | Immigrants
0.0
/100
|
#295
Tragic
97.2%
Immigrants | Eritrea
0.0
/100
|
#296
Tragic
97.2%
Central American Indians
0.0
/100
|
#297
Tragic
97.1%