Marshallese vs Dutch Bachelor's Degree

COMPARE

Marshallese
Race
Ancestry
AfghanAfricanAlaska NativeAlaskan AthabascanAlbanianAleutAlsatianAmericanApacheArabArapahoArgentineanArmenianAssyrian/Chaldean/SyriacAustralianAustrianBahamianBangladeshiBarbadianBasqueBelgianBelizeanBermudanBhutaneseBlackfeetBolivianBrazilianBritishBritish West IndianBulgarianBurmeseCajunCambodianCanadianCape VerdeanCarpatho RusynCelticCentral AmericanCentral American IndianCherokeeCheyenneChickasawChileanChineseChippewaChoctawColombianColvilleComancheCosta RicanCreeCreekCroatianCrowCubanCypriotCzechCzechoslovakianDanishDelawareDominicanDutch West IndianEastern EuropeanEcuadorianEgyptianEnglishEstonianEthiopianEuropeanFijianFilipinoFinnishFrenchFrench American IndianFrench CanadianGermanGerman RussianGhanaianGreekGuamanian/ChamorroGuatemalanGuyaneseHaitianHmongHonduranHopiHoumaHungarianIcelanderIndian (Asian)IndonesianInupiatIranianIraqiIrishIroquoisIsraeliItalianJamaicanJapaneseJordanianKenyanKiowaKoreanLaotianLatvianLebaneseLiberianLithuanianLumbeeLuxembourgerMacedonianMalaysianMalteseMarshalleseMenomineeMexicanMexican American IndianMongolianMoroccanNative HawaiianNavajoNepaleseNew ZealanderNicaraguanNigerianNorthern EuropeanNorwegianOkinawanOsageOttawaPaiutePakistaniPalestinianPanamanianParaguayanPennsylvania GermanPeruvianPimaPolishPortuguesePotawatomiPuebloPuerto RicanPuget Sound SalishRomanianRussianSalvadoranSamoanScandinavianScotch-IrishScottishSeminoleSenegaleseSerbianShoshoneSierra LeoneanSiouxSlavicSlovakSloveneSomaliSouth AfricanSouth AmericanSouth American IndianSoviet UnionSpaniardSpanishSpanish AmericanSpanish American IndianSri LankanSubsaharan AfricanSudaneseSwedishSwissSyrianTaiwaneseThaiTlingit-HaidaTohono O'OdhamTonganTrinidadian and TobagonianTsimshianTurkishU.S. Virgin IslanderUgandanUkrainianUruguayanUteVenezuelanVietnameseWelshWest IndianYakamaYaquiYugoslavianYumanYup'ikZimbabwean
Immigration
NonimmigrantsImmigrantsAfghanistanAfricaAlbaniaArgentinaArmeniaAsiaAustraliaAustriaBahamasBangladeshBarbadosBelarusBelgiumBelizeBoliviaBosnia and HerzegovinaBrazilBulgariaBurma/MyanmarCabo VerdeCambodiaCameroonCanadaCaribbeanCentral AmericaChileChinaColombiaCongoCosta RicaCroatiaCubaCzechoslovakiaDenmarkDominicaDominican RepublicEastern AfricaEastern AsiaEastern EuropeEcuadorEgyptEl SalvadorEnglandEritreaEthiopiaEuropeFijiFranceGermanyGhanaGreeceGrenadaGuatemalaGuyanaHaitiHondurasHong KongHungaryIndiaIndonesiaIranIraqIrelandIsraelItalyJamaicaJapanJordanKazakhstanKenyaKoreaKuwaitLaosLatin AmericaLatviaLebanonLiberiaLithuaniaMalaysiaMexicoMicronesiaMiddle AfricaMoldovaMoroccoNepalNetherlandsNicaraguaNigeriaNorth AmericaNorth MacedoniaNorthern AfricaNorthern EuropeNorwayOceaniaPakistanPanamaPeruPhilippinesPolandPortugalRomaniaRussiaSaudi ArabiaScotlandSenegalSerbiaSierra LeoneSingaporeSomaliaSouth AfricaSouth AmericaSouth Central AsiaSouth Eastern AsiaSouthern EuropeSpainSri LankaSt. Vincent and the GrenadinesSudanSwedenSwitzerlandSyriaTaiwanThailandTrinidad and TobagoTurkeyUgandaUkraineUruguayUzbekistanVenezuelaVietnamWest IndiesWestern AfricaWestern AsiaWestern EuropeYemenZaireZimbabweAzores
Dutch
Race
Ancestry
AfghanAfricanAlaska NativeAlaskan AthabascanAlbanianAleutAlsatianAmericanApacheArabArapahoArgentineanArmenianAssyrian/Chaldean/SyriacAustralianAustrianBahamianBangladeshiBarbadianBasqueBelgianBelizeanBermudanBhutaneseBlackfeetBolivianBrazilianBritishBritish West IndianBulgarianBurmeseCajunCambodianCanadianCape VerdeanCarpatho RusynCelticCentral AmericanCentral American IndianCherokeeCheyenneChickasawChileanChineseChippewaChoctawColombianColvilleComancheCosta RicanCreeCreekCroatianCrowCubanCypriotCzechCzechoslovakianDanishDelawareDominicanDutchDutch West IndianEastern EuropeanEcuadorianEgyptianEnglishEstonianEthiopianEuropeanFijianFilipinoFinnishFrenchFrench American IndianFrench CanadianGermanGerman RussianGhanaianGreekGuamanian/ChamorroGuatemalanGuyaneseHaitianHmongHonduranHopiHoumaHungarianIcelanderIndian (Asian)IndonesianInupiatIranianIraqiIrishIroquoisIsraeliItalianJamaicanJapaneseJordanianKenyanKiowaKoreanLaotianLatvianLebaneseLiberianLithuanianLumbeeLuxembourgerMacedonianMalaysianMalteseMenomineeMexicanMexican American IndianMongolianMoroccanNative HawaiianNavajoNepaleseNew ZealanderNicaraguanNigerianNorthern EuropeanNorwegianOkinawanOsageOttawaPaiutePakistaniPalestinianPanamanianParaguayanPennsylvania GermanPeruvianPimaPolishPortuguesePotawatomiPuebloPuerto RicanPuget Sound SalishRomanianRussianSalvadoranSamoanScandinavianScotch-IrishScottishSeminoleSenegaleseSerbianShoshoneSierra LeoneanSiouxSlavicSlovakSloveneSomaliSouth AfricanSouth AmericanSouth American IndianSoviet UnionSpaniardSpanishSpanish AmericanSpanish American IndianSri LankanSubsaharan AfricanSudaneseSwedishSwissSyrianTaiwaneseThaiTlingit-HaidaTohono O'OdhamTonganTrinidadian and TobagonianTsimshianTurkishU.S. Virgin IslanderUgandanUkrainianUruguayanUteVenezuelanVietnameseWelshWest IndianYakamaYaquiYugoslavianYumanYup'ikZimbabwean
Immigration
NonimmigrantsImmigrantsAfghanistanAfricaAlbaniaArgentinaArmeniaAsiaAustraliaAustriaBahamasBangladeshBarbadosBelarusBelgiumBelizeBoliviaBosnia and HerzegovinaBrazilBulgariaBurma/MyanmarCabo VerdeCambodiaCameroonCanadaCaribbeanCentral AmericaChileChinaColombiaCongoCosta RicaCroatiaCubaCzechoslovakiaDenmarkDominicaDominican RepublicEastern AfricaEastern AsiaEastern EuropeEcuadorEgyptEl SalvadorEnglandEritreaEthiopiaEuropeFijiFranceGermanyGhanaGreeceGrenadaGuatemalaGuyanaHaitiHondurasHong KongHungaryIndiaIndonesiaIranIraqIrelandIsraelItalyJamaicaJapanJordanKazakhstanKenyaKoreaKuwaitLaosLatin AmericaLatviaLebanonLiberiaLithuaniaMalaysiaMexicoMicronesiaMiddle AfricaMoldovaMoroccoNepalNetherlandsNicaraguaNigeriaNorth AmericaNorth MacedoniaNorthern AfricaNorthern EuropeNorwayOceaniaPakistanPanamaPeruPhilippinesPolandPortugalRomaniaRussiaSaudi ArabiaScotlandSenegalSerbiaSierra LeoneSingaporeSomaliaSouth AfricaSouth AmericaSouth Central AsiaSouth Eastern AsiaSouthern EuropeSpainSri LankaSt. Vincent and the GrenadinesSudanSwedenSwitzerlandSyriaTaiwanThailandTrinidad and TobagoTurkeyUgandaUkraineUruguayUzbekistanVenezuelaVietnamWest IndiesWestern AfricaWestern AsiaWestern EuropeYemenZaireZimbabweAzores
Bachelor's Degree
Income
Poverty
Unemployment
Labor Participation
Family Structure
Vehicle Availability
Education Level
Disability

Bachelor's Degree Comparison

Marshallese

Dutch

Tragic
Tragic
31.7%
BACHELOR'S DEGREE
0.1/ 100
METRIC RATING
278th/ 347
METRIC RANK
35.7%
BACHELOR'S DEGREE
9.2/ 100
METRIC RATING
221st/ 347
METRIC RANK

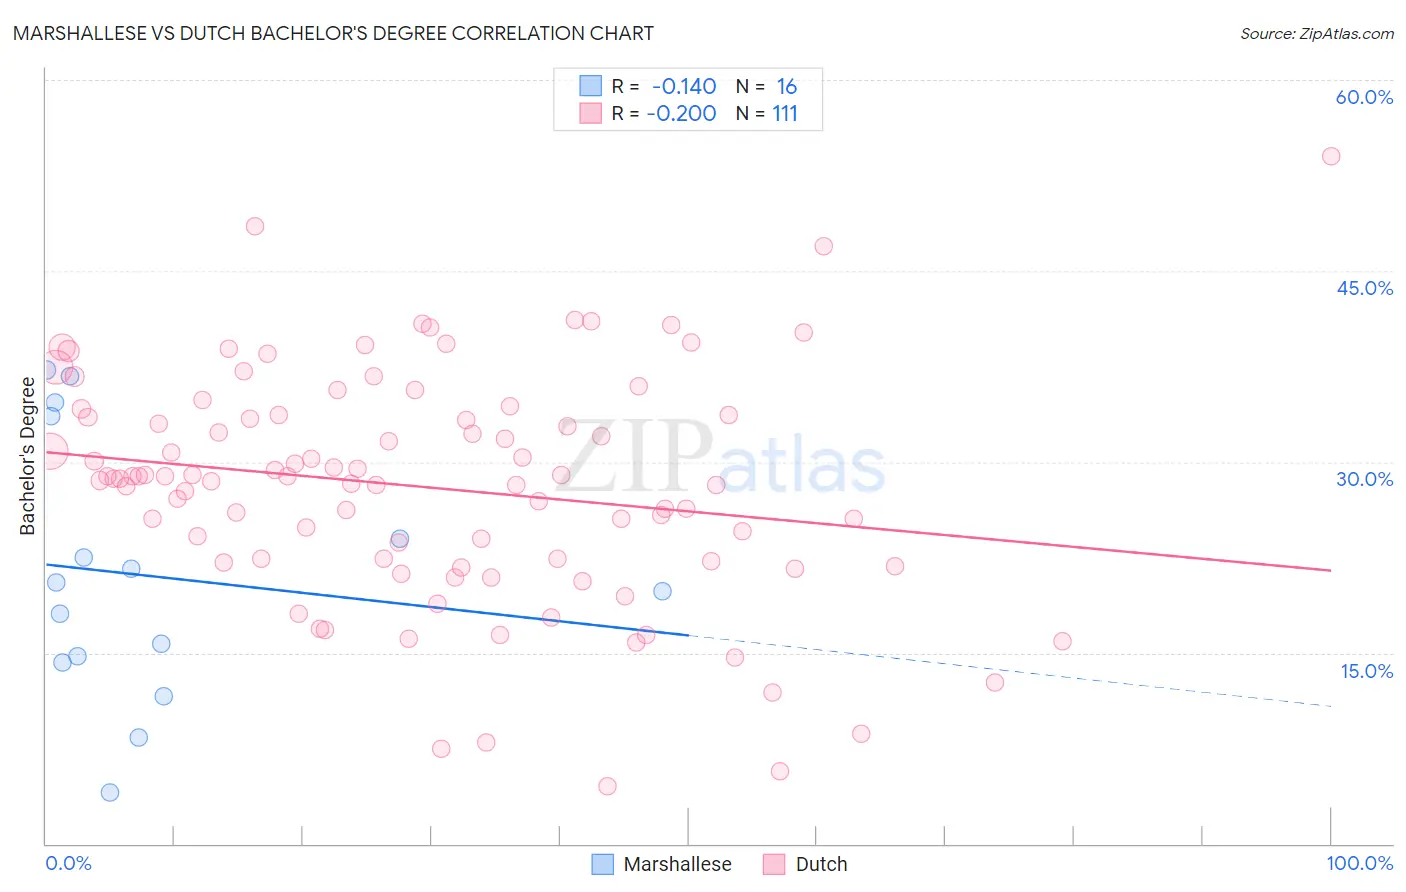
Marshallese vs Dutch Bachelor's Degree Correlation Chart

The statistical analysis conducted on geographies consisting of 14,761,315 people shows a poor negative correlation between the proportion of Marshallese and percentage of population with at least bachelor's degree education in the United States with a correlation coefficient (R) of -0.140 and weighted average of 31.7%. Similarly, the statistical analysis conducted on geographies consisting of 554,248,334 people shows a weak negative correlation between the proportion of Dutch and percentage of population with at least bachelor's degree education in the United States with a correlation coefficient (R) of -0.200 and weighted average of 35.7%, a difference of 12.6%.
Marshallese vs Dutch Bachelor's Degree

Bachelor's Degree Correlation Summary

MeasurementMarshalleseDutch
Minimum4.0%4.5%
Maximum37.2%54.1%
Range33.1%49.5%
Mean21.1%28.0%
Median20.2%28.7%
Interquartile 25% (IQ1)14.4%22.2%
Interquartile 75% (IQ3)28.8%33.7%
Interquartile Range (IQR)14.3%11.4%
Standard Deviation (Sample)10.1%9.1%
Standard Deviation (Population)9.8%9.0%

Similar Demographics by Bachelor's Degree

Demographics Similar to Marshallese by Bachelor's Degree

In terms of bachelor's degree, the demographic groups most similar to Marshallese are Dominican (31.8%, a difference of 0.050%), Salvadoran (31.8%, a difference of 0.20%), Samoan (31.8%, a difference of 0.24%), Hawaiian (31.6%, a difference of 0.35%), and Potawatomi (31.9%, a difference of 0.37%).
DemographicsRating | RankBachelor's Degree
Central Americans
0.2
/100
|
#271
Tragic
31.9%
Comanche
0.2
/100
|
#272
Tragic
31.9%
Americans
0.2
/100
|
#273
Tragic
31.9%
Potawatomi
0.2
/100
|
#274
Tragic
31.9%
Samoans
0.1
/100
|
#275
Tragic
31.8%
Salvadorans
0.1
/100
|
#276
Tragic
31.8%
Dominicans
0.1
/100
|
#277
Tragic
31.8%
Marshallese
0.1
/100
|
#278
Tragic
31.7%
Hawaiians
0.1
/100
|
#279
Tragic
31.6%
Immigrants | Laos
0.1
/100
|
#280
Tragic
31.6%
Blackfeet
0.1
/100
|
#281
Tragic
31.5%
Immigrants | Caribbean
0.1
/100
|
#282
Tragic
31.4%
Hondurans
0.1
/100
|
#283
Tragic
31.3%
Haitians
0.1
/100
|
#284
Tragic
31.3%
Aleuts
0.1
/100
|
#285
Tragic
31.3%

Demographics Similar to Dutch by Bachelor's Degree

In terms of bachelor's degree, the demographic groups most similar to Dutch are Spanish (35.8%, a difference of 0.11%), Trinidadian and Tobagonian (35.7%, a difference of 0.14%), West Indian (35.8%, a difference of 0.15%), Subsaharan African (35.8%, a difference of 0.18%), and German Russian (35.8%, a difference of 0.28%).
DemographicsRating | RankBachelor's Degree
Germans
13.9
/100
|
#214
Poor
36.1%
Immigrants | Western Africa
13.8
/100
|
#215
Poor
36.1%
Barbadians
13.5
/100
|
#216
Poor
36.1%
German Russians
10.2
/100
|
#217
Poor
35.8%
Sub-Saharan Africans
9.8
/100
|
#218
Tragic
35.8%
West Indians
9.7
/100
|
#219
Tragic
35.8%
Spanish
9.6
/100
|
#220
Tragic
35.8%
Dutch
9.2
/100
|
#221
Tragic
35.7%
Trinidadians and Tobagonians
8.8
/100
|
#222
Tragic
35.7%
French Canadians
8.3
/100
|
#223
Tragic
35.6%
Immigrants | Barbados
7.5
/100
|
#224
Tragic
35.5%
Immigrants | Burma/Myanmar
7.3
/100
|
#225
Tragic
35.5%
Portuguese
7.2
/100
|
#226
Tragic
35.5%
Ecuadorians
6.6
/100
|
#227
Tragic
35.4%
Immigrants | Trinidad and Tobago
6.0
/100
|
#228
Tragic
35.3%