Maltese vs Immigrants from Zaire Kindergarten

COMPARE

Maltese
Race
Ancestry
AfghanAfricanAlaska NativeAlaskan AthabascanAlbanianAleutAlsatianAmericanApacheArabArapahoArgentineanArmenianAssyrian/Chaldean/SyriacAustralianAustrianBahamianBangladeshiBarbadianBasqueBelgianBelizeanBermudanBhutaneseBlackfeetBolivianBrazilianBritishBritish West IndianBulgarianBurmeseCajunCambodianCanadianCape VerdeanCarpatho RusynCelticCentral AmericanCentral American IndianCherokeeCheyenneChickasawChileanChineseChippewaChoctawColombianColvilleComancheCosta RicanCreeCreekCroatianCrowCubanCypriotCzechCzechoslovakianDanishDelawareDominicanDutchDutch West IndianEastern EuropeanEcuadorianEgyptianEnglishEstonianEthiopianEuropeanFijianFilipinoFinnishFrenchFrench American IndianFrench CanadianGermanGerman RussianGhanaianGreekGuamanian/ChamorroGuatemalanGuyaneseHaitianHmongHonduranHopiHoumaHungarianIcelanderIndian (Asian)IndonesianInupiatIranianIraqiIrishIroquoisIsraeliItalianJamaicanJapaneseJordanianKenyanKiowaKoreanLaotianLatvianLebaneseLiberianLithuanianLumbeeLuxembourgerMacedonianMalaysianMalteseMarshalleseMenomineeMexicanMexican American IndianMongolianMoroccanNative HawaiianNavajoNepaleseNew ZealanderNicaraguanNigerianNorthern EuropeanNorwegianOkinawanOsageOttawaPaiutePakistaniPalestinianPanamanianParaguayanPennsylvania GermanPeruvianPimaPolishPortuguesePotawatomiPuebloPuerto RicanPuget Sound SalishRomanianRussianSalvadoranSamoanScandinavianScotch-IrishScottishSeminoleSenegaleseSerbianShoshoneSierra LeoneanSiouxSlavicSlovakSloveneSomaliSouth AfricanSouth AmericanSouth American IndianSoviet UnionSpaniardSpanishSpanish AmericanSpanish American IndianSri LankanSubsaharan AfricanSudaneseSwedishSwissSyrianTaiwaneseThaiTlingit-HaidaTohono O'OdhamTonganTrinidadian and TobagonianTsimshianTurkishU.S. Virgin IslanderUgandanUkrainianUruguayanUteVenezuelanVietnameseWelshWest IndianYakamaYaquiYugoslavianYumanYup'ikZimbabwean
Immigration
NonimmigrantsImmigrantsAfghanistanAfricaAlbaniaArgentinaArmeniaAsiaAustraliaAustriaBahamasBangladeshBarbadosBelarusBelgiumBelizeBoliviaBosnia and HerzegovinaBrazilBulgariaBurma/MyanmarCabo VerdeCambodiaCameroonCanadaCaribbeanCentral AmericaChileChinaColombiaCongoCosta RicaCroatiaCubaCzechoslovakiaDenmarkDominicaDominican RepublicEastern AfricaEastern AsiaEastern EuropeEcuadorEgyptEl SalvadorEnglandEritreaEthiopiaEuropeFijiFranceGermanyGhanaGreeceGrenadaGuatemalaGuyanaHaitiHondurasHong KongHungaryIndiaIndonesiaIranIraqIrelandIsraelItalyJamaicaJapanJordanKazakhstanKenyaKoreaKuwaitLaosLatin AmericaLatviaLebanonLiberiaLithuaniaMalaysiaMexicoMicronesiaMiddle AfricaMoldovaMoroccoNepalNetherlandsNicaraguaNigeriaNorth AmericaNorth MacedoniaNorthern AfricaNorthern EuropeNorwayOceaniaPakistanPanamaPeruPhilippinesPolandPortugalRomaniaRussiaSaudi ArabiaScotlandSenegalSerbiaSierra LeoneSingaporeSomaliaSouth AfricaSouth AmericaSouth Central AsiaSouth Eastern AsiaSouthern EuropeSpainSri LankaSt. Vincent and the GrenadinesSudanSwedenSwitzerlandSyriaTaiwanThailandTrinidad and TobagoTurkeyUgandaUkraineUruguayUzbekistanVenezuelaVietnamWest IndiesWestern AfricaWestern AsiaWestern EuropeYemenZimbabweAzores
Immigrants from Zaire
Race
Ancestry
AfghanAfricanAlaska NativeAlaskan AthabascanAlbanianAleutAlsatianAmericanApacheArabArapahoArgentineanArmenianAssyrian/Chaldean/SyriacAustralianAustrianBahamianBangladeshiBarbadianBasqueBelgianBelizeanBermudanBhutaneseBlackfeetBolivianBrazilianBritishBritish West IndianBulgarianBurmeseCajunCambodianCanadianCape VerdeanCarpatho RusynCelticCentral AmericanCentral American IndianCherokeeCheyenneChickasawChileanChineseChippewaChoctawColombianColvilleComancheCosta RicanCreeCreekCroatianCrowCubanCypriotCzechCzechoslovakianDanishDelawareDominicanDutchDutch West IndianEastern EuropeanEcuadorianEgyptianEnglishEstonianEthiopianEuropeanFijianFilipinoFinnishFrenchFrench American IndianFrench CanadianGermanGerman RussianGhanaianGreekGuamanian/ChamorroGuatemalanGuyaneseHaitianHmongHonduranHopiHoumaHungarianIcelanderIndian (Asian)IndonesianInupiatIranianIraqiIrishIroquoisIsraeliItalianJamaicanJapaneseJordanianKenyanKiowaKoreanLaotianLatvianLebaneseLiberianLithuanianLumbeeLuxembourgerMacedonianMalaysianMarshalleseMenomineeMexicanMexican American IndianMongolianMoroccanNative HawaiianNavajoNepaleseNew ZealanderNicaraguanNigerianNorthern EuropeanNorwegianOkinawanOsageOttawaPaiutePakistaniPalestinianPanamanianParaguayanPennsylvania GermanPeruvianPimaPolishPortuguesePotawatomiPuebloPuerto RicanPuget Sound SalishRomanianRussianSalvadoranSamoanScandinavianScotch-IrishScottishSeminoleSenegaleseSerbianShoshoneSierra LeoneanSiouxSlavicSlovakSloveneSomaliSouth AfricanSouth AmericanSouth American IndianSoviet UnionSpaniardSpanishSpanish AmericanSpanish American IndianSri LankanSubsaharan AfricanSudaneseSwedishSwissSyrianTaiwaneseThaiTlingit-HaidaTohono O'OdhamTonganTrinidadian and TobagonianTsimshianTurkishU.S. Virgin IslanderUgandanUkrainianUruguayanUteVenezuelanVietnameseWelshWest IndianYakamaYaquiYugoslavianYumanYup'ikZimbabwean
Immigration
NonimmigrantsImmigrantsAfghanistanAfricaAlbaniaArgentinaArmeniaAsiaAustraliaAustriaBahamasBangladeshBarbadosBelarusBelgiumBelizeBoliviaBosnia and HerzegovinaBrazilBulgariaBurma/MyanmarCabo VerdeCambodiaCameroonCanadaCaribbeanCentral AmericaChileChinaColombiaCongoCosta RicaCroatiaCubaCzechoslovakiaDenmarkDominicaDominican RepublicEastern AfricaEastern AsiaEastern EuropeEcuadorEgyptEl SalvadorEnglandEritreaEthiopiaEuropeFijiFranceGermanyGhanaGreeceGrenadaGuatemalaGuyanaHaitiHondurasHong KongHungaryIndiaIndonesiaIranIraqIrelandIsraelItalyJamaicaJapanJordanKazakhstanKenyaKoreaKuwaitLaosLatin AmericaLatviaLebanonLiberiaLithuaniaMalaysiaMexicoMicronesiaMiddle AfricaMoldovaMoroccoNepalNetherlandsNicaraguaNigeriaNorth AmericaNorth MacedoniaNorthern AfricaNorthern EuropeNorwayOceaniaPakistanPanamaPeruPhilippinesPolandPortugalRomaniaRussiaSaudi ArabiaScotlandSenegalSerbiaSierra LeoneSingaporeSomaliaSouth AfricaSouth AmericaSouth Central AsiaSouth Eastern AsiaSouthern EuropeSpainSri LankaSt. Vincent and the GrenadinesSudanSwedenSwitzerlandSyriaTaiwanThailandTrinidad and TobagoTurkeyUgandaUkraineUruguayUzbekistanVenezuelaVietnamWest IndiesWestern AfricaWestern AsiaWestern EuropeYemenZaireZimbabweAzores
Kindergarten
Income
Poverty
Unemployment
Labor Participation
Family Structure
Vehicle Availability
Education Level
Disability

Kindergarten Comparison

Maltese

Immigrants from Zaire

Exceptional
Tragic
98.4%
KINDERGARTEN
99.7/ 100
METRIC RATING
65th/ 347
METRIC RANK
97.7%
KINDERGARTEN
4.5/ 100
METRIC RATING
221st/ 347
METRIC RANK

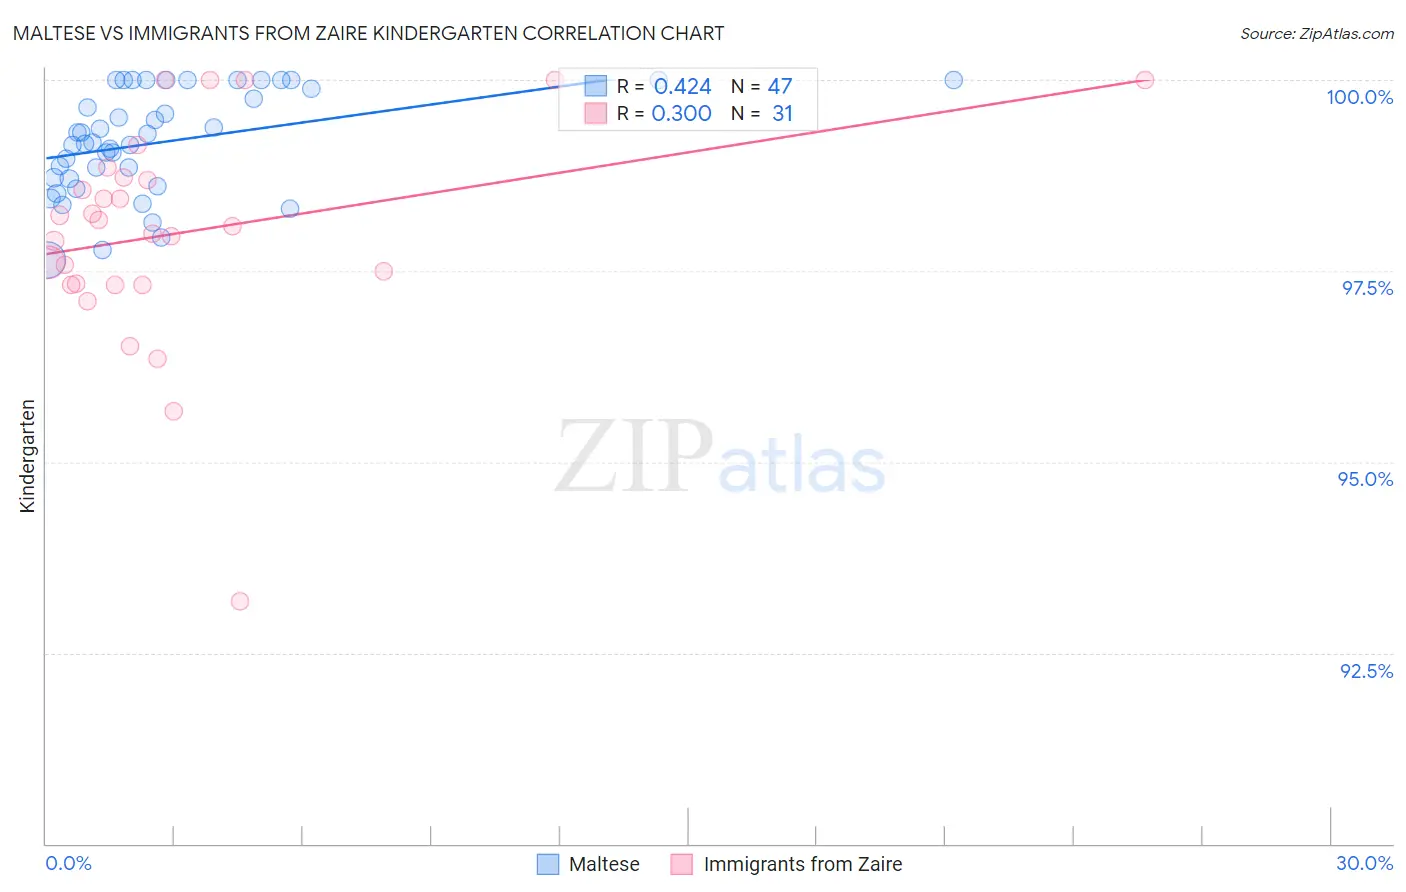
Maltese vs Immigrants from Zaire Kindergarten Correlation Chart

The statistical analysis conducted on geographies consisting of 126,476,608 people shows a moderate positive correlation between the proportion of Maltese and percentage of population with at least kindergarten education in the United States with a correlation coefficient (R) of 0.424 and weighted average of 98.4%. Similarly, the statistical analysis conducted on geographies consisting of 107,250,996 people shows a weak positive correlation between the proportion of Immigrants from Zaire and percentage of population with at least kindergarten education in the United States with a correlation coefficient (R) of 0.300 and weighted average of 97.7%, a difference of 0.68%.
Maltese vs Immigrants from Zaire Kindergarten

Kindergarten Correlation Summary

MeasurementMalteseImmigrants from Zaire
Minimum97.6%93.2%
Maximum100.0%100.0%
Range2.4%6.8%
Mean99.2%98.0%
Median99.2%98.1%
Interquartile 25% (IQ1)98.7%97.3%
Interquartile 75% (IQ3)100.0%98.7%
Interquartile Range (IQR)1.3%1.4%
Standard Deviation (Sample)0.68%1.4%
Standard Deviation (Population)0.67%1.4%

Similar Demographics by Kindergarten

Demographics Similar to Maltese by Kindergarten

In terms of kindergarten, the demographic groups most similar to Maltese are Immigrants from North America (98.4%, a difference of 0.0%), Greek (98.4%, a difference of 0.0%), Bulgarian (98.4%, a difference of 0.010%), Immigrants from Canada (98.4%, a difference of 0.010%), and Creek (98.4%, a difference of 0.010%).
DemographicsRating | RankKindergarten
Bulgarians
99.7
/100
|
#58
Exceptional
98.4%
Immigrants | Canada
99.7
/100
|
#59
Exceptional
98.4%
Creek
99.7
/100
|
#60
Exceptional
98.4%
Slavs
99.7
/100
|
#61
Exceptional
98.4%
New Zealanders
99.7
/100
|
#62
Exceptional
98.4%
Immigrants | North America
99.7
/100
|
#63
Exceptional
98.4%
Greeks
99.7
/100
|
#64
Exceptional
98.4%
Maltese
99.7
/100
|
#65
Exceptional
98.4%
Cheyenne
99.6
/100
|
#66
Exceptional
98.4%
Canadians
99.6
/100
|
#67
Exceptional
98.4%
Immigrants | Northern Europe
99.6
/100
|
#68
Exceptional
98.4%
Immigrants | Austria
99.6
/100
|
#69
Exceptional
98.4%
Russians
99.6
/100
|
#70
Exceptional
98.4%
Chickasaw
99.6
/100
|
#71
Exceptional
98.4%
Serbians
99.6
/100
|
#72
Exceptional
98.4%

Demographics Similar to Immigrants from Zaire by Kindergarten

In terms of kindergarten, the demographic groups most similar to Immigrants from Zaire are Tongan (97.7%, a difference of 0.0%), Immigrants from Sudan (97.7%, a difference of 0.0%), Immigrants from Syria (97.7%, a difference of 0.0%), Immigrants from Panama (97.7%, a difference of 0.010%), and Iraqi (97.7%, a difference of 0.010%).
DemographicsRating | RankKindergarten
Uruguayans
7.5
/100
|
#214
Tragic
97.8%
Immigrants | Bahamas
7.4
/100
|
#215
Tragic
97.8%
Samoans
6.9
/100
|
#216
Tragic
97.8%
Bahamians
6.6
/100
|
#217
Tragic
97.8%
Immigrants | Morocco
5.4
/100
|
#218
Tragic
97.7%
Immigrants | Panama
5.0
/100
|
#219
Tragic
97.7%
Tongans
4.8
/100
|
#220
Tragic
97.7%
Immigrants | Zaire
4.5
/100
|
#221
Tragic
97.7%
Immigrants | Sudan
4.5
/100
|
#222
Tragic
97.7%
Immigrants | Syria
4.3
/100
|
#223
Tragic
97.7%
Iraqis
3.9
/100
|
#224
Tragic
97.7%
Immigrants | Nepal
3.8
/100
|
#225
Tragic
97.7%
Sudanese
3.7
/100
|
#226
Tragic
97.7%
Immigrants | Costa Rica
3.6
/100
|
#227
Tragic
97.7%
Sub-Saharan Africans
3.5
/100
|
#228
Tragic
97.7%