Maltese vs Immigrants from Japan 11th Grade

COMPARE

Maltese
Race
Ancestry
AfghanAfricanAlaska NativeAlaskan AthabascanAlbanianAleutAlsatianAmericanApacheArabArapahoArgentineanArmenianAssyrian/Chaldean/SyriacAustralianAustrianBahamianBangladeshiBarbadianBasqueBelgianBelizeanBermudanBhutaneseBlackfeetBolivianBrazilianBritishBritish West IndianBulgarianBurmeseCajunCambodianCanadianCape VerdeanCarpatho RusynCelticCentral AmericanCentral American IndianCherokeeCheyenneChickasawChileanChineseChippewaChoctawColombianColvilleComancheCosta RicanCreeCreekCroatianCrowCubanCypriotCzechCzechoslovakianDanishDelawareDominicanDutchDutch West IndianEastern EuropeanEcuadorianEgyptianEnglishEstonianEthiopianEuropeanFijianFilipinoFinnishFrenchFrench American IndianFrench CanadianGermanGerman RussianGhanaianGreekGuamanian/ChamorroGuatemalanGuyaneseHaitianHmongHonduranHopiHoumaHungarianIcelanderIndian (Asian)IndonesianInupiatIranianIraqiIrishIroquoisIsraeliItalianJamaicanJapaneseJordanianKenyanKiowaKoreanLaotianLatvianLebaneseLiberianLithuanianLumbeeLuxembourgerMacedonianMalaysianMalteseMarshalleseMenomineeMexicanMexican American IndianMongolianMoroccanNative HawaiianNavajoNepaleseNew ZealanderNicaraguanNigerianNorthern EuropeanNorwegianOkinawanOsageOttawaPaiutePakistaniPalestinianPanamanianParaguayanPennsylvania GermanPeruvianPimaPolishPortuguesePotawatomiPuebloPuerto RicanPuget Sound SalishRomanianRussianSalvadoranSamoanScandinavianScotch-IrishScottishSeminoleSenegaleseSerbianShoshoneSierra LeoneanSiouxSlavicSlovakSloveneSomaliSouth AfricanSouth AmericanSouth American IndianSoviet UnionSpaniardSpanishSpanish AmericanSpanish American IndianSri LankanSubsaharan AfricanSudaneseSwedishSwissSyrianTaiwaneseThaiTlingit-HaidaTohono O'OdhamTonganTrinidadian and TobagonianTsimshianTurkishU.S. Virgin IslanderUgandanUkrainianUruguayanUteVenezuelanVietnameseWelshWest IndianYakamaYaquiYugoslavianYumanYup'ikZimbabwean
Immigration
NonimmigrantsImmigrantsAfghanistanAfricaAlbaniaArgentinaArmeniaAsiaAustraliaAustriaBahamasBangladeshBarbadosBelarusBelgiumBelizeBoliviaBosnia and HerzegovinaBrazilBulgariaBurma/MyanmarCabo VerdeCambodiaCameroonCanadaCaribbeanCentral AmericaChileChinaColombiaCongoCosta RicaCroatiaCubaCzechoslovakiaDenmarkDominicaDominican RepublicEastern AfricaEastern AsiaEastern EuropeEcuadorEgyptEl SalvadorEnglandEritreaEthiopiaEuropeFijiFranceGermanyGhanaGreeceGrenadaGuatemalaGuyanaHaitiHondurasHong KongHungaryIndiaIndonesiaIranIraqIrelandIsraelItalyJamaicaJordanKazakhstanKenyaKoreaKuwaitLaosLatin AmericaLatviaLebanonLiberiaLithuaniaMalaysiaMexicoMicronesiaMiddle AfricaMoldovaMoroccoNepalNetherlandsNicaraguaNigeriaNorth AmericaNorth MacedoniaNorthern AfricaNorthern EuropeNorwayOceaniaPakistanPanamaPeruPhilippinesPolandPortugalRomaniaRussiaSaudi ArabiaScotlandSenegalSerbiaSierra LeoneSingaporeSomaliaSouth AfricaSouth AmericaSouth Central AsiaSouth Eastern AsiaSouthern EuropeSpainSri LankaSt. Vincent and the GrenadinesSudanSwedenSwitzerlandSyriaTaiwanThailandTrinidad and TobagoTurkeyUgandaUkraineUruguayUzbekistanVenezuelaVietnamWest IndiesWestern AfricaWestern AsiaWestern EuropeYemenZaireZimbabweAzores
Immigrants from Japan
Race
Ancestry
AfghanAfricanAlaska NativeAlaskan AthabascanAlbanianAleutAlsatianAmericanApacheArabArapahoArgentineanArmenianAssyrian/Chaldean/SyriacAustralianAustrianBahamianBangladeshiBarbadianBasqueBelgianBelizeanBermudanBhutaneseBlackfeetBolivianBrazilianBritishBritish West IndianBulgarianBurmeseCajunCambodianCanadianCape VerdeanCarpatho RusynCelticCentral AmericanCentral American IndianCherokeeCheyenneChickasawChileanChineseChippewaChoctawColombianColvilleComancheCosta RicanCreeCreekCroatianCrowCubanCypriotCzechCzechoslovakianDanishDelawareDominicanDutchDutch West IndianEastern EuropeanEcuadorianEgyptianEnglishEstonianEthiopianEuropeanFijianFilipinoFinnishFrenchFrench American IndianFrench CanadianGermanGerman RussianGhanaianGreekGuamanian/ChamorroGuatemalanGuyaneseHaitianHmongHonduranHopiHoumaHungarianIcelanderIndian (Asian)IndonesianInupiatIranianIraqiIrishIroquoisIsraeliItalianJamaicanJapaneseJordanianKenyanKiowaKoreanLaotianLatvianLebaneseLiberianLithuanianLumbeeLuxembourgerMacedonianMalaysianMarshalleseMenomineeMexicanMexican American IndianMongolianMoroccanNative HawaiianNavajoNepaleseNew ZealanderNicaraguanNigerianNorthern EuropeanNorwegianOkinawanOsageOttawaPaiutePakistaniPalestinianPanamanianParaguayanPennsylvania GermanPeruvianPimaPolishPortuguesePotawatomiPuebloPuerto RicanPuget Sound SalishRomanianRussianSalvadoranSamoanScandinavianScotch-IrishScottishSeminoleSenegaleseSerbianShoshoneSierra LeoneanSiouxSlavicSlovakSloveneSomaliSouth AfricanSouth AmericanSouth American IndianSoviet UnionSpaniardSpanishSpanish AmericanSpanish American IndianSri LankanSubsaharan AfricanSudaneseSwedishSwissSyrianTaiwaneseThaiTlingit-HaidaTohono O'OdhamTonganTrinidadian and TobagonianTsimshianTurkishU.S. Virgin IslanderUgandanUkrainianUruguayanUteVenezuelanVietnameseWelshWest IndianYakamaYaquiYugoslavianYumanYup'ikZimbabwean
Immigration
NonimmigrantsImmigrantsAfghanistanAfricaAlbaniaArgentinaArmeniaAsiaAustraliaAustriaBahamasBangladeshBarbadosBelarusBelgiumBelizeBoliviaBosnia and HerzegovinaBrazilBulgariaBurma/MyanmarCabo VerdeCambodiaCameroonCanadaCaribbeanCentral AmericaChileChinaColombiaCongoCosta RicaCroatiaCubaCzechoslovakiaDenmarkDominicaDominican RepublicEastern AfricaEastern AsiaEastern EuropeEcuadorEgyptEl SalvadorEnglandEritreaEthiopiaEuropeFijiFranceGermanyGhanaGreeceGrenadaGuatemalaGuyanaHaitiHondurasHong KongHungaryIndiaIndonesiaIranIraqIrelandIsraelItalyJamaicaJapanJordanKazakhstanKenyaKoreaKuwaitLaosLatin AmericaLatviaLebanonLiberiaLithuaniaMalaysiaMexicoMicronesiaMiddle AfricaMoldovaMoroccoNepalNetherlandsNicaraguaNigeriaNorth AmericaNorth MacedoniaNorthern AfricaNorthern EuropeNorwayOceaniaPakistanPanamaPeruPhilippinesPolandPortugalRomaniaRussiaSaudi ArabiaScotlandSenegalSerbiaSierra LeoneSingaporeSomaliaSouth AfricaSouth AmericaSouth Central AsiaSouth Eastern AsiaSouthern EuropeSpainSri LankaSt. Vincent and the GrenadinesSudanSwedenSwitzerlandSyriaTaiwanThailandTrinidad and TobagoTurkeyUgandaUkraineUruguayUzbekistanVenezuelaVietnamWest IndiesWestern AfricaWestern AsiaWestern EuropeYemenZaireZimbabweAzores
11th Grade
Income
Poverty
Unemployment
Labor Participation
Family Structure
Vehicle Availability
Education Level
Disability

11th Grade Comparison

Maltese

Immigrants from Japan

Exceptional
Exceptional
94.5%
11TH GRADE
100.0/ 100
METRIC RATING
18th/ 347
METRIC RANK
93.8%
11TH GRADE
99.7/ 100
METRIC RATING
72nd/ 347
METRIC RANK

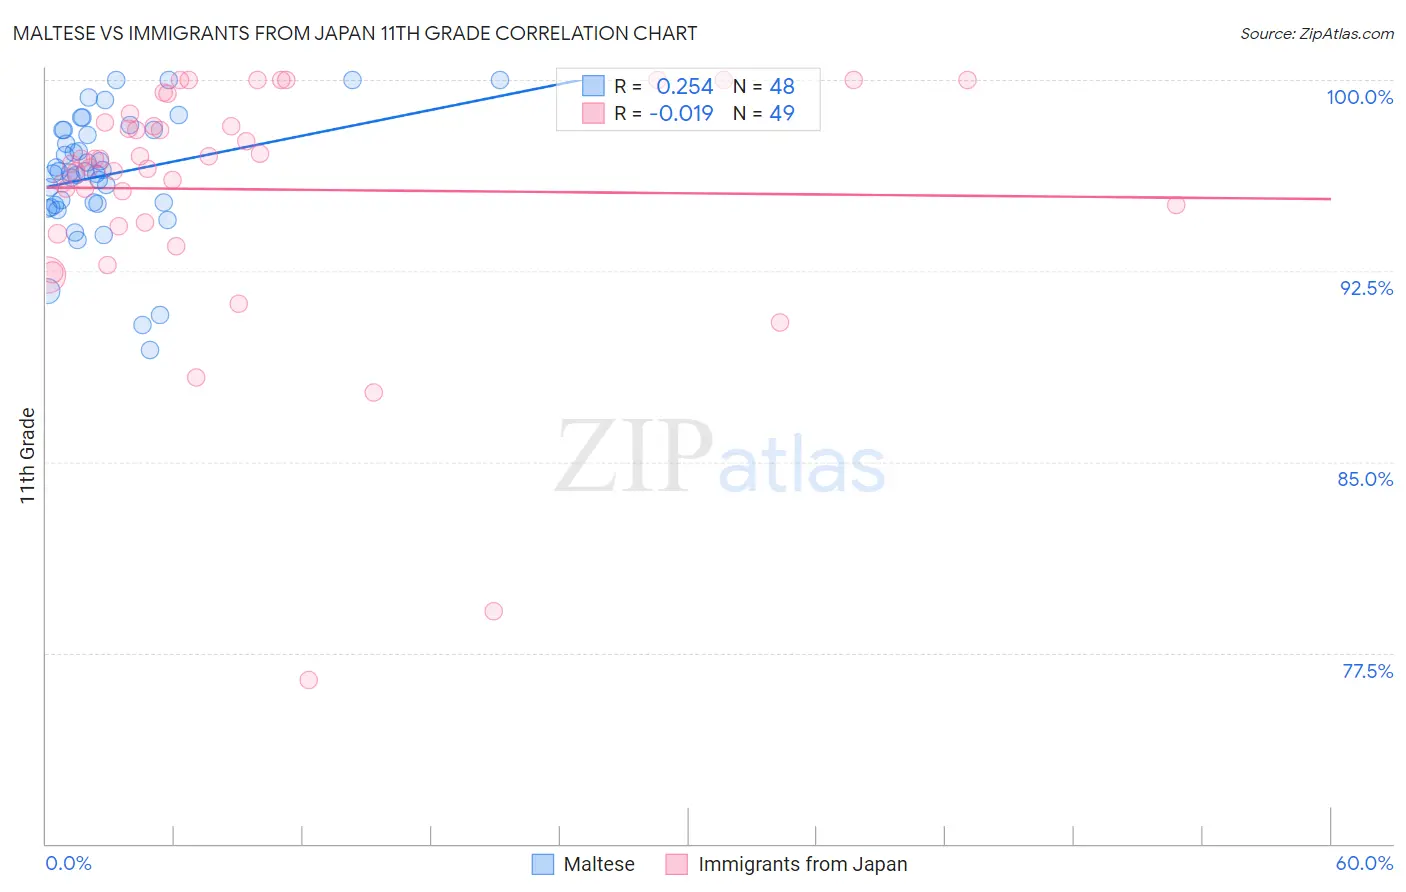
Maltese vs Immigrants from Japan 11th Grade Correlation Chart

The statistical analysis conducted on geographies consisting of 126,478,070 people shows a weak positive correlation between the proportion of Maltese and percentage of population with at least 11th grade education in the United States with a correlation coefficient (R) of 0.254 and weighted average of 94.5%. Similarly, the statistical analysis conducted on geographies consisting of 340,148,942 people shows no correlation between the proportion of Immigrants from Japan and percentage of population with at least 11th grade education in the United States with a correlation coefficient (R) of -0.019 and weighted average of 93.8%, a difference of 0.72%.
Maltese vs Immigrants from Japan 11th Grade

11th Grade Correlation Summary

MeasurementMalteseImmigrants from Japan
Minimum89.4%76.5%
Maximum100.0%100.0%
Range10.6%23.5%
Mean96.3%95.7%
Median96.4%96.9%
Interquartile 25% (IQ1)95.1%94.3%
Interquartile 75% (IQ3)98.0%98.5%
Interquartile Range (IQR)2.9%4.2%
Standard Deviation (Sample)2.4%4.8%
Standard Deviation (Population)2.4%4.8%

Similar Demographics by 11th Grade

Demographics Similar to Maltese by 11th Grade

In terms of 11th grade, the demographic groups most similar to Maltese are Luxembourger (94.5%, a difference of 0.0%), Scandinavian (94.5%, a difference of 0.0%), Bulgarian (94.5%, a difference of 0.010%), Immigrants from India (94.5%, a difference of 0.010%), and Italian (94.5%, a difference of 0.030%).
DemographicsRating | Rank11th Grade
Germans
100.0
/100
|
#11
Exceptional
94.7%
Latvians
100.0
/100
|
#12
Exceptional
94.7%
Chinese
100.0
/100
|
#13
Exceptional
94.6%
Eastern Europeans
100.0
/100
|
#14
Exceptional
94.6%
Bulgarians
100.0
/100
|
#15
Exceptional
94.5%
Immigrants | India
100.0
/100
|
#16
Exceptional
94.5%
Luxembourgers
100.0
/100
|
#17
Exceptional
94.5%
Maltese
100.0
/100
|
#18
Exceptional
94.5%
Scandinavians
100.0
/100
|
#19
Exceptional
94.5%
Italians
100.0
/100
|
#20
Exceptional
94.5%
Tlingit-Haida
100.0
/100
|
#21
Exceptional
94.4%
Tsimshian
100.0
/100
|
#22
Exceptional
94.4%
Czechs
100.0
/100
|
#23
Exceptional
94.4%
English
100.0
/100
|
#24
Exceptional
94.4%
Irish
100.0
/100
|
#25
Exceptional
94.4%

Demographics Similar to Immigrants from Japan by 11th Grade

In terms of 11th grade, the demographic groups most similar to Immigrants from Japan are Romanian (93.8%, a difference of 0.020%), Immigrants from Czechoslovakia (93.8%, a difference of 0.020%), Immigrants from South Africa (93.8%, a difference of 0.030%), Immigrants from England (93.8%, a difference of 0.040%), and Immigrants from Latvia (93.8%, a difference of 0.040%).
DemographicsRating | Rank11th Grade
Native Hawaiians
99.8
/100
|
#65
Exceptional
93.9%
Alaskan Athabascans
99.8
/100
|
#66
Exceptional
93.9%
Immigrants | Netherlands
99.8
/100
|
#67
Exceptional
93.9%
Zimbabweans
99.8
/100
|
#68
Exceptional
93.9%
Scotch-Irish
99.8
/100
|
#69
Exceptional
93.9%
Immigrants | England
99.7
/100
|
#70
Exceptional
93.8%
Immigrants | South Africa
99.7
/100
|
#71
Exceptional
93.8%
Immigrants | Japan
99.7
/100
|
#72
Exceptional
93.8%
Romanians
99.6
/100
|
#73
Exceptional
93.8%
Immigrants | Czechoslovakia
99.6
/100
|
#74
Exceptional
93.8%
Immigrants | Latvia
99.6
/100
|
#75
Exceptional
93.8%
Celtics
99.5
/100
|
#76
Exceptional
93.7%
Aleuts
99.5
/100
|
#77
Exceptional
93.7%
Soviet Union
99.5
/100
|
#78
Exceptional
93.7%
Immigrants | Denmark
99.5
/100
|
#79
Exceptional
93.7%