Maltese vs Immigrants from Guatemala 12th Grade, No Diploma

COMPARE

Maltese
Race
Ancestry
AfghanAfricanAlaska NativeAlaskan AthabascanAlbanianAleutAlsatianAmericanApacheArabArapahoArgentineanArmenianAssyrian/Chaldean/SyriacAustralianAustrianBahamianBangladeshiBarbadianBasqueBelgianBelizeanBermudanBhutaneseBlackfeetBolivianBrazilianBritishBritish West IndianBulgarianBurmeseCajunCambodianCanadianCape VerdeanCarpatho RusynCelticCentral AmericanCentral American IndianCherokeeCheyenneChickasawChileanChineseChippewaChoctawColombianColvilleComancheCosta RicanCreeCreekCroatianCrowCubanCypriotCzechCzechoslovakianDanishDelawareDominicanDutchDutch West IndianEastern EuropeanEcuadorianEgyptianEnglishEstonianEthiopianEuropeanFijianFilipinoFinnishFrenchFrench American IndianFrench CanadianGermanGerman RussianGhanaianGreekGuamanian/ChamorroGuatemalanGuyaneseHaitianHmongHonduranHopiHoumaHungarianIcelanderIndian (Asian)IndonesianInupiatIranianIraqiIrishIroquoisIsraeliItalianJamaicanJapaneseJordanianKenyanKiowaKoreanLaotianLatvianLebaneseLiberianLithuanianLumbeeLuxembourgerMacedonianMalaysianMalteseMarshalleseMenomineeMexicanMexican American IndianMongolianMoroccanNative HawaiianNavajoNepaleseNew ZealanderNicaraguanNigerianNorthern EuropeanNorwegianOkinawanOsageOttawaPaiutePakistaniPalestinianPanamanianParaguayanPennsylvania GermanPeruvianPimaPolishPortuguesePotawatomiPuebloPuerto RicanPuget Sound SalishRomanianRussianSalvadoranSamoanScandinavianScotch-IrishScottishSeminoleSenegaleseSerbianShoshoneSierra LeoneanSiouxSlavicSlovakSloveneSomaliSouth AfricanSouth AmericanSouth American IndianSoviet UnionSpaniardSpanishSpanish AmericanSpanish American IndianSri LankanSubsaharan AfricanSudaneseSwedishSwissSyrianTaiwaneseThaiTlingit-HaidaTohono O'OdhamTonganTrinidadian and TobagonianTsimshianTurkishU.S. Virgin IslanderUgandanUkrainianUruguayanUteVenezuelanVietnameseWelshWest IndianYakamaYaquiYugoslavianYumanYup'ikZimbabwean
Immigration
NonimmigrantsImmigrantsAfghanistanAfricaAlbaniaArgentinaArmeniaAsiaAustraliaAustriaBahamasBangladeshBarbadosBelarusBelgiumBelizeBoliviaBosnia and HerzegovinaBrazilBulgariaBurma/MyanmarCabo VerdeCambodiaCameroonCanadaCaribbeanCentral AmericaChileChinaColombiaCongoCosta RicaCroatiaCubaCzechoslovakiaDenmarkDominicaDominican RepublicEastern AfricaEastern AsiaEastern EuropeEcuadorEgyptEl SalvadorEnglandEritreaEthiopiaEuropeFijiFranceGermanyGhanaGreeceGrenadaGuyanaHaitiHondurasHong KongHungaryIndiaIndonesiaIranIraqIrelandIsraelItalyJamaicaJapanJordanKazakhstanKenyaKoreaKuwaitLaosLatin AmericaLatviaLebanonLiberiaLithuaniaMalaysiaMexicoMicronesiaMiddle AfricaMoldovaMoroccoNepalNetherlandsNicaraguaNigeriaNorth AmericaNorth MacedoniaNorthern AfricaNorthern EuropeNorwayOceaniaPakistanPanamaPeruPhilippinesPolandPortugalRomaniaRussiaSaudi ArabiaScotlandSenegalSerbiaSierra LeoneSingaporeSomaliaSouth AfricaSouth AmericaSouth Central AsiaSouth Eastern AsiaSouthern EuropeSpainSri LankaSt. Vincent and the GrenadinesSudanSwedenSwitzerlandSyriaTaiwanThailandTrinidad and TobagoTurkeyUgandaUkraineUruguayUzbekistanVenezuelaVietnamWest IndiesWestern AfricaWestern AsiaWestern EuropeYemenZaireZimbabweAzores
Immigrants from Guatemala
Race
Ancestry
AfghanAfricanAlaska NativeAlaskan AthabascanAlbanianAleutAlsatianAmericanApacheArabArapahoArgentineanArmenianAssyrian/Chaldean/SyriacAustralianAustrianBahamianBangladeshiBarbadianBasqueBelgianBelizeanBermudanBhutaneseBlackfeetBolivianBrazilianBritishBritish West IndianBulgarianBurmeseCajunCambodianCanadianCape VerdeanCarpatho RusynCelticCentral AmericanCentral American IndianCherokeeCheyenneChickasawChileanChineseChippewaChoctawColombianColvilleComancheCosta RicanCreeCreekCroatianCrowCubanCypriotCzechCzechoslovakianDanishDelawareDominicanDutchDutch West IndianEastern EuropeanEcuadorianEgyptianEnglishEstonianEthiopianEuropeanFijianFilipinoFinnishFrenchFrench American IndianFrench CanadianGermanGerman RussianGhanaianGreekGuamanian/ChamorroGuatemalanGuyaneseHaitianHmongHonduranHopiHoumaHungarianIcelanderIndian (Asian)IndonesianInupiatIranianIraqiIrishIroquoisIsraeliItalianJamaicanJapaneseJordanianKenyanKiowaKoreanLaotianLatvianLebaneseLiberianLithuanianLumbeeLuxembourgerMacedonianMalaysianMarshalleseMenomineeMexicanMexican American IndianMongolianMoroccanNative HawaiianNavajoNepaleseNew ZealanderNicaraguanNigerianNorthern EuropeanNorwegianOkinawanOsageOttawaPaiutePakistaniPalestinianPanamanianParaguayanPennsylvania GermanPeruvianPimaPolishPortuguesePotawatomiPuebloPuerto RicanPuget Sound SalishRomanianRussianSalvadoranSamoanScandinavianScotch-IrishScottishSeminoleSenegaleseSerbianShoshoneSierra LeoneanSiouxSlavicSlovakSloveneSomaliSouth AfricanSouth AmericanSouth American IndianSoviet UnionSpaniardSpanishSpanish AmericanSpanish American IndianSri LankanSubsaharan AfricanSudaneseSwedishSwissSyrianTaiwaneseThaiTlingit-HaidaTohono O'OdhamTonganTrinidadian and TobagonianTsimshianTurkishU.S. Virgin IslanderUgandanUkrainianUruguayanUteVenezuelanVietnameseWelshWest IndianYakamaYaquiYugoslavianYumanYup'ikZimbabwean
Immigration
NonimmigrantsImmigrantsAfghanistanAfricaAlbaniaArgentinaArmeniaAsiaAustraliaAustriaBahamasBangladeshBarbadosBelarusBelgiumBelizeBoliviaBosnia and HerzegovinaBrazilBulgariaBurma/MyanmarCabo VerdeCambodiaCameroonCanadaCaribbeanCentral AmericaChileChinaColombiaCongoCosta RicaCroatiaCubaCzechoslovakiaDenmarkDominicaDominican RepublicEastern AfricaEastern AsiaEastern EuropeEcuadorEgyptEl SalvadorEnglandEritreaEthiopiaEuropeFijiFranceGermanyGhanaGreeceGrenadaGuatemalaGuyanaHaitiHondurasHong KongHungaryIndiaIndonesiaIranIraqIrelandIsraelItalyJamaicaJapanJordanKazakhstanKenyaKoreaKuwaitLaosLatin AmericaLatviaLebanonLiberiaLithuaniaMalaysiaMexicoMicronesiaMiddle AfricaMoldovaMoroccoNepalNetherlandsNicaraguaNigeriaNorth AmericaNorth MacedoniaNorthern AfricaNorthern EuropeNorwayOceaniaPakistanPanamaPeruPhilippinesPolandPortugalRomaniaRussiaSaudi ArabiaScotlandSenegalSerbiaSierra LeoneSingaporeSomaliaSouth AfricaSouth AmericaSouth Central AsiaSouth Eastern AsiaSouthern EuropeSpainSri LankaSt. Vincent and the GrenadinesSudanSwedenSwitzerlandSyriaTaiwanThailandTrinidad and TobagoTurkeyUgandaUkraineUruguayUzbekistanVenezuelaVietnamWest IndiesWestern AfricaWestern AsiaWestern EuropeYemenZaireZimbabweAzores
12th Grade, No Diploma
Income
Poverty
Unemployment
Labor Participation
Family Structure
Vehicle Availability
Education Level
Disability

12th Grade, No Diploma Comparison

Maltese

Immigrants from Guatemala

Exceptional
Tragic
93.3%
12TH GRADE, NO DIPLOMA
100.0/ 100
METRIC RATING
16th/ 347
METRIC RANK
84.0%
12TH GRADE, NO DIPLOMA
0.0/ 100
METRIC RATING
341st/ 347
METRIC RANK

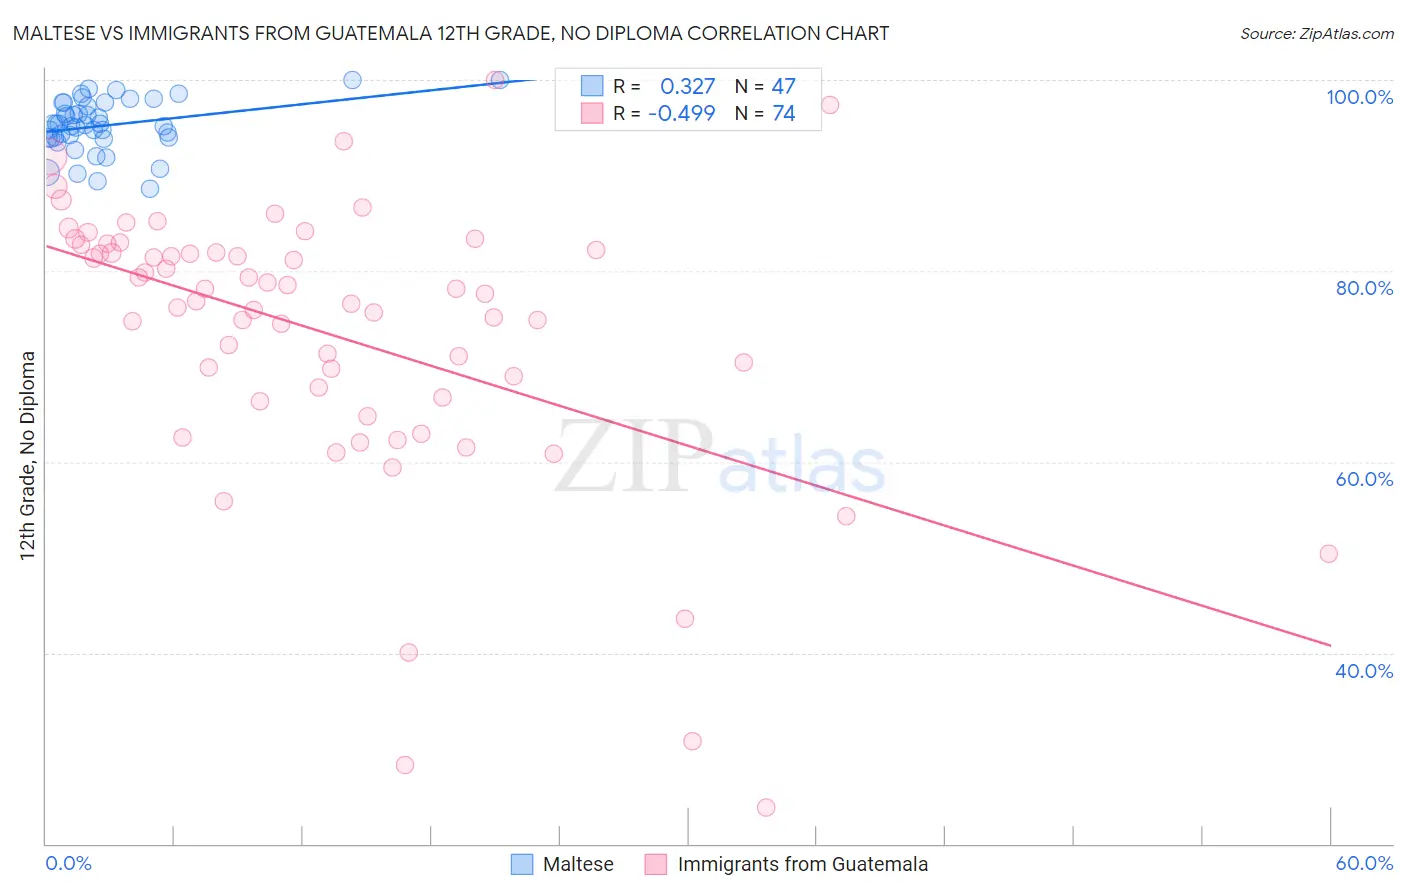
Maltese vs Immigrants from Guatemala 12th Grade, No Diploma Correlation Chart

The statistical analysis conducted on geographies consisting of 126,478,003 people shows a mild positive correlation between the proportion of Maltese and percentage of population with at least 12th grade (no diploma) education in the United States with a correlation coefficient (R) of 0.327 and weighted average of 93.3%. Similarly, the statistical analysis conducted on geographies consisting of 377,286,142 people shows a moderate negative correlation between the proportion of Immigrants from Guatemala and percentage of population with at least 12th grade (no diploma) education in the United States with a correlation coefficient (R) of -0.499 and weighted average of 84.0%, a difference of 11.1%.
Maltese vs Immigrants from Guatemala 12th Grade, No Diploma

12th Grade, No Diploma Correlation Summary

MeasurementMalteseImmigrants from Guatemala
Minimum88.6%23.9%
Maximum100.0%100.0%
Range11.4%76.1%
Mean95.2%73.4%
Median95.2%77.2%
Interquartile 25% (IQ1)93.9%66.8%
Interquartile 75% (IQ3)97.6%82.2%
Interquartile Range (IQR)3.7%15.4%
Standard Deviation (Sample)2.7%14.7%
Standard Deviation (Population)2.7%14.6%

Similar Demographics by 12th Grade, No Diploma

Demographics Similar to Maltese by 12th Grade, No Diploma

In terms of 12th grade, no diploma, the demographic groups most similar to Maltese are Luxembourger (93.3%, a difference of 0.020%), Finnish (93.4%, a difference of 0.040%), Immigrants from Singapore (93.3%, a difference of 0.050%), German (93.3%, a difference of 0.070%), and Filipino (93.2%, a difference of 0.10%).
DemographicsRating | Rank12th Grade, No Diploma
Latvians
100.0
/100
|
#9
Exceptional
93.6%
Croatians
100.0
/100
|
#10
Exceptional
93.5%
Poles
100.0
/100
|
#11
Exceptional
93.5%
Eastern Europeans
100.0
/100
|
#12
Exceptional
93.5%
Danes
100.0
/100
|
#13
Exceptional
93.5%
Bulgarians
100.0
/100
|
#14
Exceptional
93.5%
Finns
100.0
/100
|
#15
Exceptional
93.4%
Maltese
100.0
/100
|
#16
Exceptional
93.3%
Luxembourgers
100.0
/100
|
#17
Exceptional
93.3%
Immigrants | Singapore
99.9
/100
|
#18
Exceptional
93.3%
Germans
99.9
/100
|
#19
Exceptional
93.3%
Filipinos
99.9
/100
|
#20
Exceptional
93.2%
Italians
99.9
/100
|
#21
Exceptional
93.2%
Estonians
99.9
/100
|
#22
Exceptional
93.2%
Scandinavians
99.9
/100
|
#23
Exceptional
93.2%

Demographics Similar to Immigrants from Guatemala by 12th Grade, No Diploma

In terms of 12th grade, no diploma, the demographic groups most similar to Immigrants from Guatemala are Mexican (84.1%, a difference of 0.14%), Houma (83.7%, a difference of 0.34%), Immigrants from El Salvador (83.6%, a difference of 0.51%), Salvadoran (84.5%, a difference of 0.56%), and Guatemalan (84.6%, a difference of 0.65%).
DemographicsRating | Rank12th Grade, No Diploma
Immigrants | Latin America
0.0
/100
|
#333
Tragic
85.0%
Immigrants | Dominican Republic
0.0
/100
|
#334
Tragic
84.9%
Immigrants | Yemen
0.0
/100
|
#335
Tragic
84.8%
Tohono O'odham
0.0
/100
|
#336
Tragic
84.7%
Pima
0.0
/100
|
#337
Tragic
84.6%
Guatemalans
0.0
/100
|
#338
Tragic
84.6%
Salvadorans
0.0
/100
|
#339
Tragic
84.5%
Mexicans
0.0
/100
|
#340
Tragic
84.1%
Immigrants | Guatemala
0.0
/100
|
#341
Tragic
84.0%
Houma
0.0
/100
|
#342
Tragic
83.7%
Immigrants | El Salvador
0.0
/100
|
#343
Tragic
83.6%
Immigrants | Central America
0.0
/100
|
#344
Tragic
83.0%
Spanish American Indians
0.0
/100
|
#345
Tragic
82.9%
Yakama
0.0
/100
|
#346
Tragic
82.5%
Immigrants | Mexico
0.0
/100
|
#347
Tragic
82.4%