Malaysian vs Hungarian Kindergarten

COMPARE

Malaysian
Race
Ancestry
AfghanAfricanAlaska NativeAlaskan AthabascanAlbanianAleutAlsatianAmericanApacheArabArapahoArgentineanArmenianAssyrian/Chaldean/SyriacAustralianAustrianBahamianBangladeshiBarbadianBasqueBelgianBelizeanBermudanBhutaneseBlackfeetBolivianBrazilianBritishBritish West IndianBulgarianBurmeseCajunCambodianCanadianCape VerdeanCarpatho RusynCelticCentral AmericanCentral American IndianCherokeeCheyenneChickasawChileanChineseChippewaChoctawColombianColvilleComancheCosta RicanCreeCreekCroatianCrowCubanCypriotCzechCzechoslovakianDanishDelawareDominicanDutchDutch West IndianEastern EuropeanEcuadorianEgyptianEnglishEstonianEthiopianEuropeanFijianFilipinoFinnishFrenchFrench American IndianFrench CanadianGermanGerman RussianGhanaianGreekGuamanian/ChamorroGuatemalanGuyaneseHaitianHmongHonduranHopiHoumaIcelanderIndian (Asian)IndonesianInupiatIranianIraqiIrishIroquoisIsraeliItalianJamaicanJapaneseJordanianKenyanKiowaKoreanLaotianLatvianLebaneseLiberianLithuanianLumbeeLuxembourgerMacedonianMalaysianMalteseMarshalleseMenomineeMexicanMexican American IndianMongolianMoroccanNative HawaiianNavajoNepaleseNew ZealanderNicaraguanNigerianNorthern EuropeanNorwegianOkinawanOsageOttawaPaiutePakistaniPalestinianPanamanianParaguayanPennsylvania GermanPeruvianPimaPolishPortuguesePotawatomiPuebloPuerto RicanPuget Sound SalishRomanianRussianSalvadoranSamoanScandinavianScotch-IrishScottishSeminoleSenegaleseSerbianShoshoneSierra LeoneanSiouxSlavicSlovakSloveneSomaliSouth AfricanSouth AmericanSouth American IndianSoviet UnionSpaniardSpanishSpanish AmericanSpanish American IndianSri LankanSubsaharan AfricanSudaneseSwedishSwissSyrianTaiwaneseThaiTlingit-HaidaTohono O'OdhamTonganTrinidadian and TobagonianTsimshianTurkishU.S. Virgin IslanderUgandanUkrainianUruguayanUteVenezuelanVietnameseWelshWest IndianYakamaYaquiYugoslavianYumanYup'ikZimbabwean
Immigration
NonimmigrantsImmigrantsAfghanistanAfricaAlbaniaArgentinaArmeniaAsiaAustraliaAustriaBahamasBangladeshBarbadosBelarusBelgiumBelizeBoliviaBosnia and HerzegovinaBrazilBulgariaBurma/MyanmarCabo VerdeCambodiaCameroonCanadaCaribbeanCentral AmericaChileChinaColombiaCongoCosta RicaCroatiaCubaCzechoslovakiaDenmarkDominicaDominican RepublicEastern AfricaEastern AsiaEastern EuropeEcuadorEgyptEl SalvadorEnglandEritreaEthiopiaEuropeFijiFranceGermanyGhanaGreeceGrenadaGuatemalaGuyanaHaitiHondurasHong KongHungaryIndiaIndonesiaIranIraqIrelandIsraelItalyJamaicaJapanJordanKazakhstanKenyaKoreaKuwaitLaosLatin AmericaLatviaLebanonLiberiaLithuaniaMalaysiaMexicoMicronesiaMiddle AfricaMoldovaMoroccoNepalNetherlandsNicaraguaNigeriaNorth AmericaNorth MacedoniaNorthern AfricaNorthern EuropeNorwayOceaniaPakistanPanamaPeruPhilippinesPolandPortugalRomaniaRussiaSaudi ArabiaScotlandSenegalSerbiaSierra LeoneSingaporeSomaliaSouth AfricaSouth AmericaSouth Central AsiaSouth Eastern AsiaSouthern EuropeSpainSri LankaSt. Vincent and the GrenadinesSudanSwedenSwitzerlandSyriaTaiwanThailandTrinidad and TobagoTurkeyUgandaUkraineUruguayUzbekistanVenezuelaVietnamWest IndiesWestern AfricaWestern AsiaWestern EuropeYemenZaireZimbabweAzores
Hungarian
Race
Ancestry
AfghanAfricanAlaska NativeAlaskan AthabascanAlbanianAleutAlsatianAmericanApacheArabArapahoArgentineanArmenianAssyrian/Chaldean/SyriacAustralianAustrianBahamianBangladeshiBarbadianBasqueBelgianBelizeanBermudanBhutaneseBlackfeetBolivianBrazilianBritishBritish West IndianBulgarianBurmeseCajunCambodianCanadianCape VerdeanCarpatho RusynCelticCentral AmericanCentral American IndianCherokeeCheyenneChickasawChileanChineseChippewaChoctawColombianColvilleComancheCosta RicanCreeCreekCroatianCrowCubanCypriotCzechCzechoslovakianDanishDelawareDominicanDutchDutch West IndianEastern EuropeanEcuadorianEgyptianEnglishEstonianEthiopianEuropeanFijianFilipinoFinnishFrenchFrench American IndianFrench CanadianGermanGerman RussianGhanaianGreekGuamanian/ChamorroGuatemalanGuyaneseHaitianHmongHonduranHopiHoumaHungarianIcelanderIndian (Asian)IndonesianInupiatIranianIraqiIrishIroquoisIsraeliItalianJamaicanJapaneseJordanianKenyanKiowaKoreanLaotianLatvianLebaneseLiberianLithuanianLumbeeLuxembourgerMacedonianMalteseMarshalleseMenomineeMexicanMexican American IndianMongolianMoroccanNative HawaiianNavajoNepaleseNew ZealanderNicaraguanNigerianNorthern EuropeanNorwegianOkinawanOsageOttawaPaiutePakistaniPalestinianPanamanianParaguayanPennsylvania GermanPeruvianPimaPolishPortuguesePotawatomiPuebloPuerto RicanPuget Sound SalishRomanianRussianSalvadoranSamoanScandinavianScotch-IrishScottishSeminoleSenegaleseSerbianShoshoneSierra LeoneanSiouxSlavicSlovakSloveneSomaliSouth AfricanSouth AmericanSouth American IndianSoviet UnionSpaniardSpanishSpanish AmericanSpanish American IndianSri LankanSubsaharan AfricanSudaneseSwedishSwissSyrianTaiwaneseThaiTlingit-HaidaTohono O'OdhamTonganTrinidadian and TobagonianTsimshianTurkishU.S. Virgin IslanderUgandanUkrainianUruguayanUteVenezuelanVietnameseWelshWest IndianYakamaYaquiYugoslavianYumanYup'ikZimbabwean
Immigration
NonimmigrantsImmigrantsAfghanistanAfricaAlbaniaArgentinaArmeniaAsiaAustraliaAustriaBahamasBangladeshBarbadosBelarusBelgiumBelizeBoliviaBosnia and HerzegovinaBrazilBulgariaBurma/MyanmarCabo VerdeCambodiaCameroonCanadaCaribbeanCentral AmericaChileChinaColombiaCongoCosta RicaCroatiaCubaCzechoslovakiaDenmarkDominicaDominican RepublicEastern AfricaEastern AsiaEastern EuropeEcuadorEgyptEl SalvadorEnglandEritreaEthiopiaEuropeFijiFranceGermanyGhanaGreeceGrenadaGuatemalaGuyanaHaitiHondurasHong KongHungaryIndiaIndonesiaIranIraqIrelandIsraelItalyJamaicaJapanJordanKazakhstanKenyaKoreaKuwaitLaosLatin AmericaLatviaLebanonLiberiaLithuaniaMalaysiaMexicoMicronesiaMiddle AfricaMoldovaMoroccoNepalNetherlandsNicaraguaNigeriaNorth AmericaNorth MacedoniaNorthern AfricaNorthern EuropeNorwayOceaniaPakistanPanamaPeruPhilippinesPolandPortugalRomaniaRussiaSaudi ArabiaScotlandSenegalSerbiaSierra LeoneSingaporeSomaliaSouth AfricaSouth AmericaSouth Central AsiaSouth Eastern AsiaSouthern EuropeSpainSri LankaSt. Vincent and the GrenadinesSudanSwedenSwitzerlandSyriaTaiwanThailandTrinidad and TobagoTurkeyUgandaUkraineUruguayUzbekistanVenezuelaVietnamWest IndiesWestern AfricaWestern AsiaWestern EuropeYemenZaireZimbabweAzores
Kindergarten
Income
Poverty
Unemployment
Labor Participation
Family Structure
Vehicle Availability
Education Level
Disability

Kindergarten Comparison

Malaysians

Hungarians

Tragic
Exceptional
97.2%
KINDERGARTEN
0.0/ 100
METRIC RATING
293rd/ 347
METRIC RANK
98.5%
KINDERGARTEN
99.9/ 100
METRIC RATING
46th/ 347
METRIC RANK

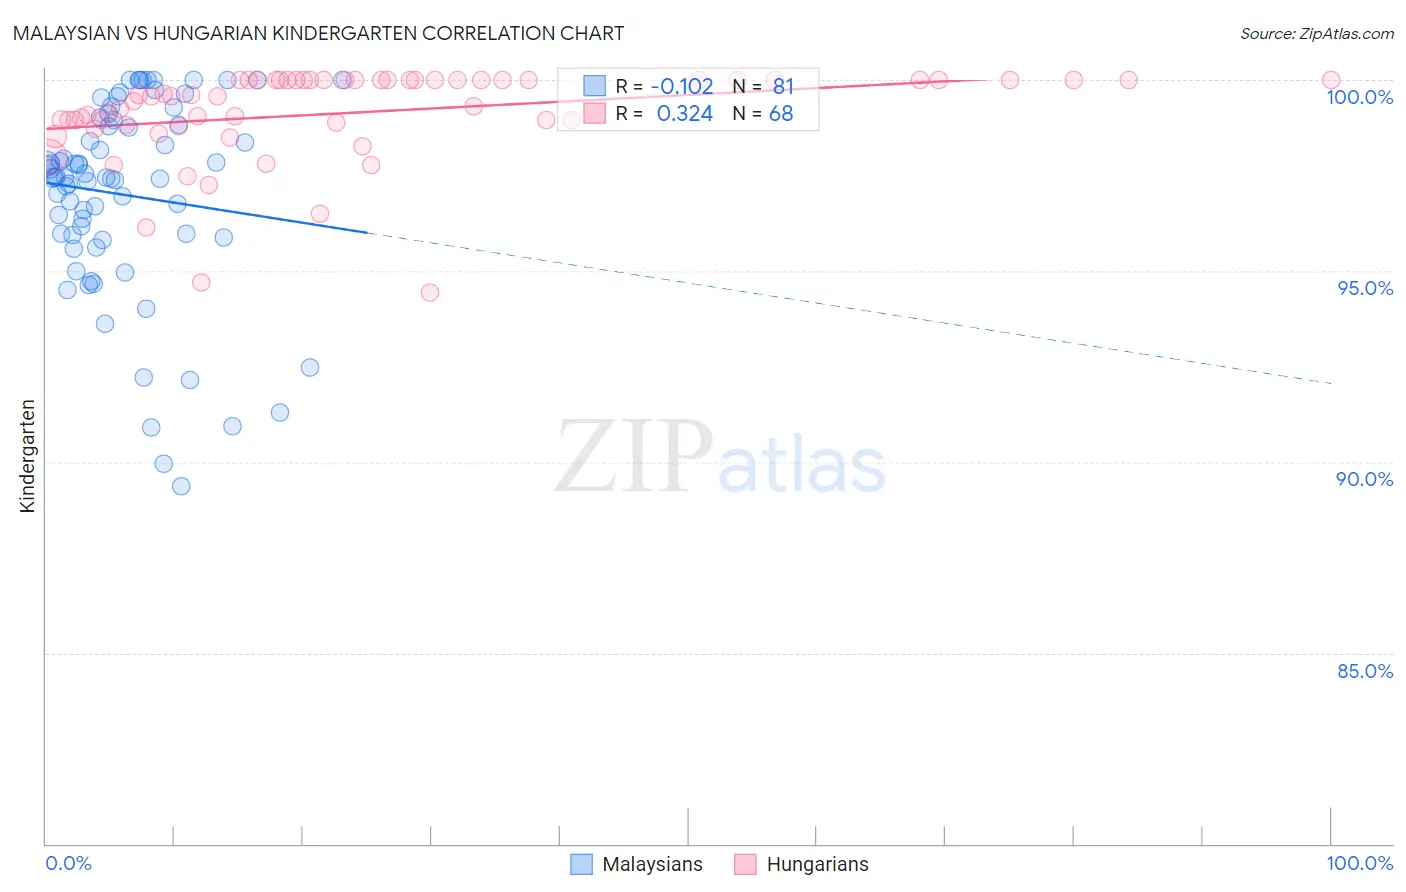
Malaysian vs Hungarian Kindergarten Correlation Chart

The statistical analysis conducted on geographies consisting of 226,107,000 people shows a poor negative correlation between the proportion of Malaysians and percentage of population with at least kindergarten education in the United States with a correlation coefficient (R) of -0.102 and weighted average of 97.2%. Similarly, the statistical analysis conducted on geographies consisting of 486,239,439 people shows a mild positive correlation between the proportion of Hungarians and percentage of population with at least kindergarten education in the United States with a correlation coefficient (R) of 0.324 and weighted average of 98.5%, a difference of 1.3%.
Malaysian vs Hungarian Kindergarten

Kindergarten Correlation Summary

MeasurementMalaysianHungarian
Minimum89.4%94.4%
Maximum100.0%100.0%
Range10.6%5.6%
Mean97.0%99.1%
Median97.4%99.6%
Interquartile 25% (IQ1)95.9%98.9%
Interquartile 75% (IQ3)98.9%100.0%
Interquartile Range (IQR)3.0%1.1%
Standard Deviation (Sample)2.5%1.2%
Standard Deviation (Population)2.5%1.2%

Similar Demographics by Kindergarten

Demographics Similar to Malaysians by Kindergarten

In terms of kindergarten, the demographic groups most similar to Malaysians are British West Indian (97.3%, a difference of 0.010%), Houma (97.3%, a difference of 0.030%), Immigrants (97.2%, a difference of 0.030%), Immigrants from Grenada (97.2%, a difference of 0.030%), and Immigrants from Eritrea (97.2%, a difference of 0.040%).
DemographicsRating | RankKindergarten
Immigrants | Barbados
0.0
/100
|
#286
Tragic
97.3%
Immigrants | Hong Kong
0.0
/100
|
#287
Tragic
97.3%
Immigrants | Thailand
0.0
/100
|
#288
Tragic
97.3%
Immigrants | Afghanistan
0.0
/100
|
#289
Tragic
97.3%
Immigrants | St. Vincent and the Grenadines
0.0
/100
|
#290
Tragic
97.3%
Houma
0.0
/100
|
#291
Tragic
97.3%
British West Indians
0.0
/100
|
#292
Tragic
97.3%
Malaysians
0.0
/100
|
#293
Tragic
97.2%
Immigrants | Immigrants
0.0
/100
|
#294
Tragic
97.2%
Immigrants | Grenada
0.0
/100
|
#295
Tragic
97.2%
Immigrants | Eritrea
0.0
/100
|
#296
Tragic
97.2%
Central American Indians
0.0
/100
|
#297
Tragic
97.2%
Immigrants | Dominica
0.0
/100
|
#298
Tragic
97.1%
Immigrants | Cuba
0.0
/100
|
#299
Tragic
97.1%
Haitians
0.0
/100
|
#300
Tragic
97.1%

Demographics Similar to Hungarians by Kindergarten

In terms of kindergarten, the demographic groups most similar to Hungarians are Czechoslovakian (98.4%, a difference of 0.010%), Lumbee (98.5%, a difference of 0.020%), Northern European (98.5%, a difference of 0.020%), Belgian (98.5%, a difference of 0.020%), and Ottawa (98.4%, a difference of 0.020%).
DemographicsRating | RankKindergarten
Chippewa
99.9
/100
|
#39
Exceptional
98.5%
Luxembourgers
99.9
/100
|
#40
Exceptional
98.5%
Eastern Europeans
99.9
/100
|
#41
Exceptional
98.5%
Native Hawaiians
99.9
/100
|
#42
Exceptional
98.5%
Lumbee
99.9
/100
|
#43
Exceptional
98.5%
Northern Europeans
99.9
/100
|
#44
Exceptional
98.5%
Belgians
99.9
/100
|
#45
Exceptional
98.5%
Hungarians
99.9
/100
|
#46
Exceptional
98.5%
Czechoslovakians
99.8
/100
|
#47
Exceptional
98.4%
Ottawa
99.8
/100
|
#48
Exceptional
98.4%
Kiowa
99.8
/100
|
#49
Exceptional
98.4%
Whites/Caucasians
99.8
/100
|
#50
Exceptional
98.4%
Estonians
99.8
/100
|
#51
Exceptional
98.4%
Australians
99.8
/100
|
#52
Exceptional
98.4%
Celtics
99.8
/100
|
#53
Exceptional
98.4%