Lumbee vs Immigrants from North America 7th Grade

COMPARE

Lumbee
Race
Ancestry
AfghanAfricanAlaska NativeAlaskan AthabascanAlbanianAleutAlsatianAmericanApacheArabArapahoArgentineanArmenianAssyrian/Chaldean/SyriacAustralianAustrianBahamianBangladeshiBarbadianBasqueBelgianBelizeanBermudanBhutaneseBlackfeetBolivianBrazilianBritishBritish West IndianBulgarianBurmeseCajunCambodianCanadianCape VerdeanCarpatho RusynCelticCentral AmericanCentral American IndianCherokeeCheyenneChickasawChileanChineseChippewaChoctawColombianColvilleComancheCosta RicanCreeCreekCroatianCrowCubanCypriotCzechCzechoslovakianDanishDelawareDominicanDutchDutch West IndianEastern EuropeanEcuadorianEgyptianEnglishEstonianEthiopianEuropeanFijianFilipinoFinnishFrenchFrench American IndianFrench CanadianGermanGerman RussianGhanaianGreekGuamanian/ChamorroGuatemalanGuyaneseHaitianHmongHonduranHopiHoumaHungarianIcelanderIndian (Asian)IndonesianInupiatIranianIraqiIrishIroquoisIsraeliItalianJamaicanJapaneseJordanianKenyanKiowaKoreanLaotianLatvianLebaneseLiberianLithuanianLumbeeLuxembourgerMacedonianMalaysianMalteseMarshalleseMenomineeMexicanMexican American IndianMongolianMoroccanNative HawaiianNavajoNepaleseNew ZealanderNicaraguanNigerianNorthern EuropeanNorwegianOkinawanOsageOttawaPaiutePakistaniPalestinianPanamanianParaguayanPennsylvania GermanPeruvianPimaPolishPortuguesePotawatomiPuebloPuerto RicanPuget Sound SalishRomanianRussianSalvadoranSamoanScandinavianScotch-IrishScottishSeminoleSenegaleseSerbianShoshoneSierra LeoneanSiouxSlavicSlovakSloveneSomaliSouth AfricanSouth AmericanSouth American IndianSoviet UnionSpaniardSpanishSpanish AmericanSpanish American IndianSri LankanSubsaharan AfricanSudaneseSwedishSwissSyrianTaiwaneseThaiTlingit-HaidaTohono O'OdhamTonganTrinidadian and TobagonianTsimshianTurkishU.S. Virgin IslanderUgandanUkrainianUruguayanUteVenezuelanVietnameseWelshWest IndianYakamaYaquiYugoslavianYumanYup'ikZimbabwean
Immigration
NonimmigrantsImmigrantsAfghanistanAfricaAlbaniaArgentinaArmeniaAsiaAustraliaAustriaBahamasBangladeshBarbadosBelarusBelgiumBelizeBoliviaBosnia and HerzegovinaBrazilBulgariaBurma/MyanmarCabo VerdeCambodiaCameroonCanadaCaribbeanCentral AmericaChileChinaColombiaCongoCosta RicaCroatiaCubaCzechoslovakiaDenmarkDominicaDominican RepublicEastern AfricaEastern AsiaEastern EuropeEcuadorEgyptEl SalvadorEnglandEritreaEthiopiaEuropeFijiFranceGermanyGhanaGreeceGrenadaGuatemalaGuyanaHaitiHondurasHong KongHungaryIndiaIndonesiaIranIraqIrelandIsraelItalyJamaicaJapanJordanKazakhstanKenyaKoreaKuwaitLaosLatin AmericaLatviaLebanonLiberiaLithuaniaMalaysiaMexicoMicronesiaMiddle AfricaMoldovaMoroccoNepalNetherlandsNicaraguaNigeriaNorth MacedoniaNorthern AfricaNorthern EuropeNorwayOceaniaPakistanPanamaPeruPhilippinesPolandPortugalRomaniaRussiaSaudi ArabiaScotlandSenegalSerbiaSierra LeoneSingaporeSomaliaSouth AfricaSouth AmericaSouth Central AsiaSouth Eastern AsiaSouthern EuropeSpainSri LankaSt. Vincent and the GrenadinesSudanSwedenSwitzerlandSyriaTaiwanThailandTrinidad and TobagoTurkeyUgandaUkraineUruguayUzbekistanVenezuelaVietnamWest IndiesWestern AfricaWestern AsiaWestern EuropeYemenZaireZimbabweAzores
Immigrants from North America
Race
Ancestry
AfghanAfricanAlaska NativeAlaskan AthabascanAlbanianAleutAlsatianAmericanApacheArabArapahoArgentineanArmenianAssyrian/Chaldean/SyriacAustralianAustrianBahamianBangladeshiBarbadianBasqueBelgianBelizeanBermudanBhutaneseBlackfeetBolivianBrazilianBritishBritish West IndianBulgarianBurmeseCajunCambodianCanadianCape VerdeanCarpatho RusynCelticCentral AmericanCentral American IndianCherokeeCheyenneChickasawChileanChineseChippewaChoctawColombianColvilleComancheCosta RicanCreeCreekCroatianCrowCubanCypriotCzechCzechoslovakianDanishDelawareDominicanDutchDutch West IndianEastern EuropeanEcuadorianEgyptianEnglishEstonianEthiopianEuropeanFijianFilipinoFinnishFrenchFrench American IndianFrench CanadianGermanGerman RussianGhanaianGreekGuamanian/ChamorroGuatemalanGuyaneseHaitianHmongHonduranHopiHoumaHungarianIcelanderIndian (Asian)IndonesianInupiatIranianIraqiIrishIroquoisIsraeliItalianJamaicanJapaneseJordanianKenyanKiowaKoreanLaotianLatvianLebaneseLiberianLithuanianLuxembourgerMacedonianMalaysianMalteseMarshalleseMenomineeMexicanMexican American IndianMongolianMoroccanNative HawaiianNavajoNepaleseNew ZealanderNicaraguanNigerianNorthern EuropeanNorwegianOkinawanOsageOttawaPaiutePakistaniPalestinianPanamanianParaguayanPennsylvania GermanPeruvianPimaPolishPortuguesePotawatomiPuebloPuerto RicanPuget Sound SalishRomanianRussianSalvadoranSamoanScandinavianScotch-IrishScottishSeminoleSenegaleseSerbianShoshoneSierra LeoneanSiouxSlavicSlovakSloveneSomaliSouth AfricanSouth AmericanSouth American IndianSoviet UnionSpaniardSpanishSpanish AmericanSpanish American IndianSri LankanSubsaharan AfricanSudaneseSwedishSwissSyrianTaiwaneseThaiTlingit-HaidaTohono O'OdhamTonganTrinidadian and TobagonianTsimshianTurkishU.S. Virgin IslanderUgandanUkrainianUruguayanUteVenezuelanVietnameseWelshWest IndianYakamaYaquiYugoslavianYumanYup'ikZimbabwean
Immigration
NonimmigrantsImmigrantsAfghanistanAfricaAlbaniaArgentinaArmeniaAsiaAustraliaAustriaBahamasBangladeshBarbadosBelarusBelgiumBelizeBoliviaBosnia and HerzegovinaBrazilBulgariaBurma/MyanmarCabo VerdeCambodiaCameroonCanadaCaribbeanCentral AmericaChileChinaColombiaCongoCosta RicaCroatiaCubaCzechoslovakiaDenmarkDominicaDominican RepublicEastern AfricaEastern AsiaEastern EuropeEcuadorEgyptEl SalvadorEnglandEritreaEthiopiaEuropeFijiFranceGermanyGhanaGreeceGrenadaGuatemalaGuyanaHaitiHondurasHong KongHungaryIndiaIndonesiaIranIraqIrelandIsraelItalyJamaicaJapanJordanKazakhstanKenyaKoreaKuwaitLaosLatin AmericaLatviaLebanonLiberiaLithuaniaMalaysiaMexicoMicronesiaMiddle AfricaMoldovaMoroccoNepalNetherlandsNicaraguaNigeriaNorth AmericaNorth MacedoniaNorthern AfricaNorthern EuropeNorwayOceaniaPakistanPanamaPeruPhilippinesPolandPortugalRomaniaRussiaSaudi ArabiaScotlandSenegalSerbiaSierra LeoneSingaporeSomaliaSouth AfricaSouth AmericaSouth Central AsiaSouth Eastern AsiaSouthern EuropeSpainSri LankaSt. Vincent and the GrenadinesSudanSwedenSwitzerlandSyriaTaiwanThailandTrinidad and TobagoTurkeyUgandaUkraineUruguayUzbekistanVenezuelaVietnamWest IndiesWestern AfricaWestern AsiaWestern EuropeYemenZaireZimbabweAzores
7th Grade
Income
Poverty
Unemployment
Labor Participation
Family Structure
Vehicle Availability
Education Level
Disability

7th Grade Comparison

Lumbee

Immigrants from North America

Exceptional
Exceptional
96.6%
7TH GRADE
97.8/ 100
METRIC RATING
107th/ 347
METRIC RANK
96.9%
7TH GRADE
99.8/ 100
METRIC RATING
62nd/ 347
METRIC RANK

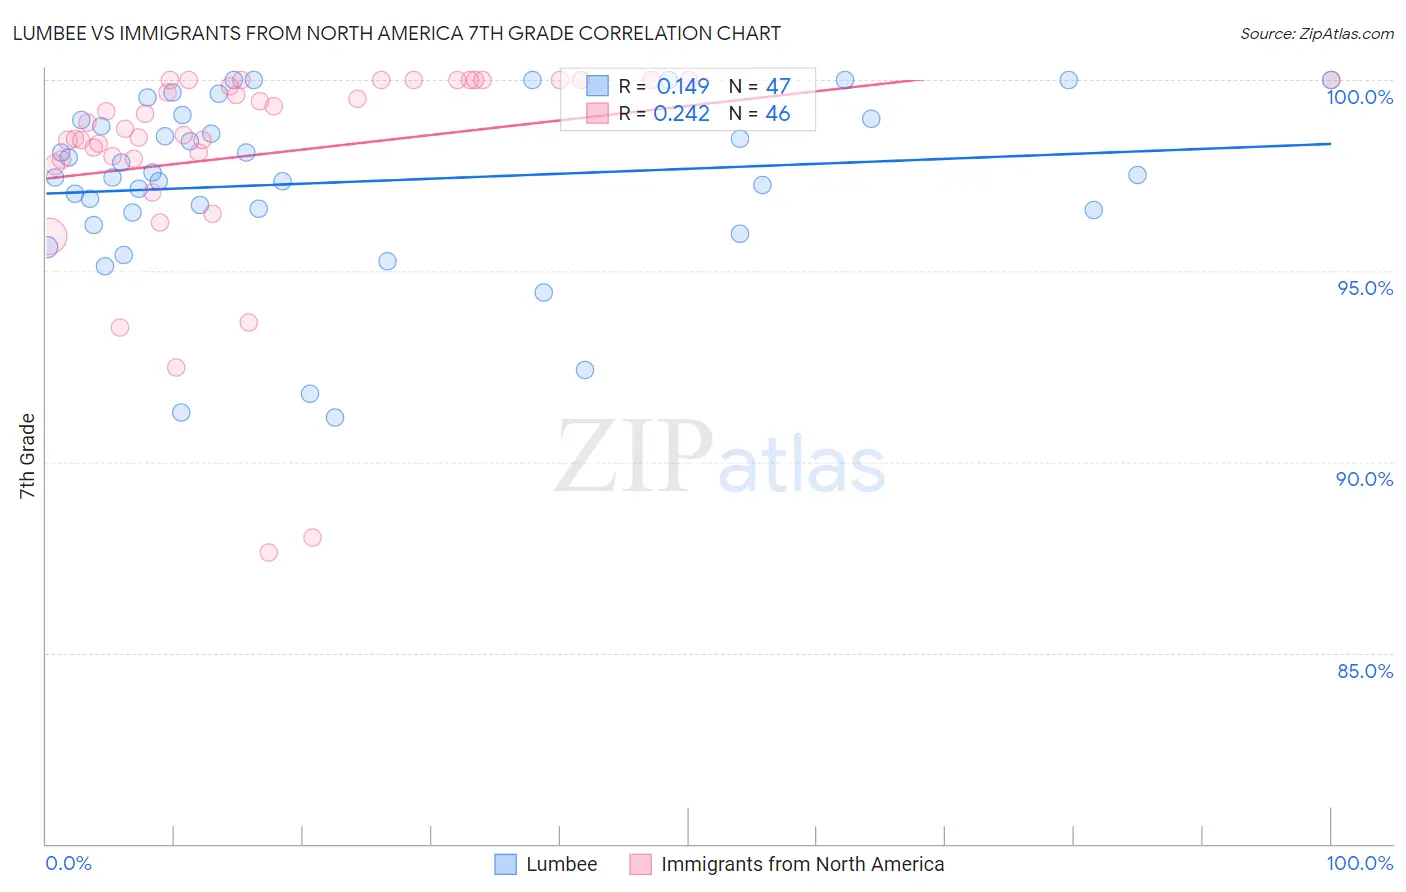
Lumbee vs Immigrants from North America 7th Grade Correlation Chart

The statistical analysis conducted on geographies consisting of 92,299,110 people shows a poor positive correlation between the proportion of Lumbee and percentage of population with at least 7th grade education in the United States with a correlation coefficient (R) of 0.149 and weighted average of 96.6%. Similarly, the statistical analysis conducted on geographies consisting of 462,462,330 people shows a weak positive correlation between the proportion of Immigrants from North America and percentage of population with at least 7th grade education in the United States with a correlation coefficient (R) of 0.242 and weighted average of 96.9%, a difference of 0.35%.
Lumbee vs Immigrants from North America 7th Grade

7th Grade Correlation Summary

MeasurementLumbeeImmigrants from North America
Minimum91.1%87.6%
Maximum100.0%100.0%
Range8.9%12.4%
Mean97.3%98.1%
Median97.5%98.8%
Interquartile 25% (IQ1)96.5%97.9%
Interquartile 75% (IQ3)99.0%100.0%
Interquartile Range (IQR)2.5%2.1%
Standard Deviation (Sample)2.3%2.8%
Standard Deviation (Population)2.3%2.8%

Similar Demographics by 7th Grade

Demographics Similar to Lumbee by 7th Grade

In terms of 7th grade, the demographic groups most similar to Lumbee are Immigrants from Saudi Arabia (96.6%, a difference of 0.0%), Iroquois (96.6%, a difference of 0.010%), Bhutanese (96.6%, a difference of 0.010%), Shoshone (96.6%, a difference of 0.020%), and South African (96.6%, a difference of 0.020%).
DemographicsRating | Rank7th Grade
German Russians
98.6
/100
|
#100
Exceptional
96.7%
Thais
98.6
/100
|
#101
Exceptional
96.7%
Immigrants | Czechoslovakia
98.3
/100
|
#102
Exceptional
96.6%
Immigrants | Singapore
98.3
/100
|
#103
Exceptional
96.6%
Shoshone
98.1
/100
|
#104
Exceptional
96.6%
South Africans
98.0
/100
|
#105
Exceptional
96.6%
Iroquois
97.9
/100
|
#106
Exceptional
96.6%
Lumbee
97.8
/100
|
#107
Exceptional
96.6%
Immigrants | Saudi Arabia
97.8
/100
|
#108
Exceptional
96.6%
Bhutanese
97.7
/100
|
#109
Exceptional
96.6%
Okinawans
97.4
/100
|
#110
Exceptional
96.6%
Immigrants | Latvia
97.4
/100
|
#111
Exceptional
96.6%
Immigrants | Nonimmigrants
97.0
/100
|
#112
Exceptional
96.5%
Pueblo
96.8
/100
|
#113
Exceptional
96.5%
Immigrants | Zimbabwe
96.6
/100
|
#114
Exceptional
96.5%

Demographics Similar to Immigrants from North America by 7th Grade

In terms of 7th grade, the demographic groups most similar to Immigrants from North America are Immigrants from Canada (96.9%, a difference of 0.010%), Creek (96.9%, a difference of 0.010%), Immigrants from Northern Europe (96.9%, a difference of 0.010%), White/Caucasian (97.0%, a difference of 0.020%), and Macedonian (97.0%, a difference of 0.020%).
DemographicsRating | Rank7th Grade
Russians
99.8
/100
|
#55
Exceptional
97.0%
Serbians
99.8
/100
|
#56
Exceptional
97.0%
Americans
99.8
/100
|
#57
Exceptional
97.0%
Whites/Caucasians
99.8
/100
|
#58
Exceptional
97.0%
Macedonians
99.8
/100
|
#59
Exceptional
97.0%
Immigrants | Canada
99.8
/100
|
#60
Exceptional
96.9%
Creek
99.8
/100
|
#61
Exceptional
96.9%
Immigrants | North America
99.8
/100
|
#62
Exceptional
96.9%
Immigrants | Northern Europe
99.7
/100
|
#63
Exceptional
96.9%
Immigrants | Austria
99.7
/100
|
#64
Exceptional
96.9%
Canadians
99.7
/100
|
#65
Exceptional
96.9%
Ukrainians
99.7
/100
|
#66
Exceptional
96.9%
Native Hawaiians
99.7
/100
|
#67
Exceptional
96.9%
Immigrants | India
99.6
/100
|
#68
Exceptional
96.9%
Iranians
99.6
/100
|
#69
Exceptional
96.8%