Lebanese vs Luxembourger Kindergarten

COMPARE

Lebanese
Race
Ancestry
AfghanAfricanAlaska NativeAlaskan AthabascanAlbanianAleutAlsatianAmericanApacheArabArapahoArgentineanArmenianAssyrian/Chaldean/SyriacAustralianAustrianBahamianBangladeshiBarbadianBasqueBelgianBelizeanBermudanBhutaneseBlackfeetBolivianBrazilianBritishBritish West IndianBulgarianBurmeseCajunCambodianCanadianCape VerdeanCarpatho RusynCelticCentral AmericanCentral American IndianCherokeeCheyenneChickasawChileanChineseChippewaChoctawColombianColvilleComancheCosta RicanCreeCreekCroatianCrowCubanCypriotCzechCzechoslovakianDanishDelawareDominicanDutchDutch West IndianEastern EuropeanEcuadorianEgyptianEnglishEstonianEthiopianEuropeanFijianFilipinoFinnishFrenchFrench American IndianFrench CanadianGermanGerman RussianGhanaianGreekGuamanian/ChamorroGuatemalanGuyaneseHaitianHmongHonduranHopiHoumaHungarianIcelanderIndian (Asian)IndonesianInupiatIranianIraqiIrishIroquoisIsraeliItalianJamaicanJapaneseJordanianKenyanKiowaKoreanLaotianLatvianLebaneseLiberianLithuanianLumbeeMacedonianMalaysianMalteseMarshalleseMenomineeMexicanMexican American IndianMongolianMoroccanNative HawaiianNavajoNepaleseNew ZealanderNicaraguanNigerianNorthern EuropeanNorwegianOkinawanOsageOttawaPaiutePakistaniPalestinianPanamanianParaguayanPennsylvania GermanPeruvianPimaPolishPortuguesePotawatomiPuebloPuerto RicanPuget Sound SalishRomanianRussianSalvadoranSamoanScandinavianScotch-IrishScottishSeminoleSenegaleseSerbianShoshoneSierra LeoneanSiouxSlavicSlovakSloveneSomaliSouth AfricanSouth AmericanSouth American IndianSoviet UnionSpaniardSpanishSpanish AmericanSpanish American IndianSri LankanSubsaharan AfricanSudaneseSwedishSwissSyrianTaiwaneseThaiTlingit-HaidaTohono O'OdhamTonganTrinidadian and TobagonianTsimshianTurkishU.S. Virgin IslanderUgandanUkrainianUruguayanUteVenezuelanVietnameseWelshWest IndianYakamaYaquiYugoslavianYumanYup'ikZimbabwean
Immigration
NonimmigrantsImmigrantsAfghanistanAfricaAlbaniaArgentinaArmeniaAsiaAustraliaAustriaBahamasBangladeshBarbadosBelarusBelgiumBelizeBoliviaBosnia and HerzegovinaBrazilBulgariaBurma/MyanmarCabo VerdeCambodiaCameroonCanadaCaribbeanCentral AmericaChileChinaColombiaCongoCosta RicaCroatiaCubaCzechoslovakiaDenmarkDominicaDominican RepublicEastern AfricaEastern AsiaEastern EuropeEcuadorEgyptEl SalvadorEnglandEritreaEthiopiaEuropeFijiFranceGermanyGhanaGreeceGrenadaGuatemalaGuyanaHaitiHondurasHong KongHungaryIndiaIndonesiaIranIraqIrelandIsraelItalyJamaicaJapanJordanKazakhstanKenyaKoreaKuwaitLaosLatin AmericaLatviaLebanonLiberiaLithuaniaMalaysiaMexicoMicronesiaMiddle AfricaMoldovaMoroccoNepalNetherlandsNicaraguaNigeriaNorth AmericaNorth MacedoniaNorthern AfricaNorthern EuropeNorwayOceaniaPakistanPanamaPeruPhilippinesPolandPortugalRomaniaRussiaSaudi ArabiaScotlandSenegalSerbiaSierra LeoneSingaporeSomaliaSouth AfricaSouth AmericaSouth Central AsiaSouth Eastern AsiaSouthern EuropeSpainSri LankaSt. Vincent and the GrenadinesSudanSwedenSwitzerlandSyriaTaiwanThailandTrinidad and TobagoTurkeyUgandaUkraineUruguayUzbekistanVenezuelaVietnamWest IndiesWestern AfricaWestern AsiaWestern EuropeYemenZaireZimbabweAzores
Luxembourger
Race
Ancestry
AfghanAfricanAlaska NativeAlaskan AthabascanAlbanianAleutAlsatianAmericanApacheArabArapahoArgentineanArmenianAssyrian/Chaldean/SyriacAustralianAustrianBahamianBangladeshiBarbadianBasqueBelgianBelizeanBermudanBhutaneseBlackfeetBolivianBrazilianBritishBritish West IndianBulgarianBurmeseCajunCambodianCanadianCape VerdeanCarpatho RusynCelticCentral AmericanCentral American IndianCherokeeCheyenneChickasawChileanChineseChippewaChoctawColombianColvilleComancheCosta RicanCreeCreekCroatianCrowCubanCypriotCzechCzechoslovakianDanishDelawareDominicanDutchDutch West IndianEastern EuropeanEcuadorianEgyptianEnglishEstonianEthiopianEuropeanFijianFilipinoFinnishFrenchFrench American IndianFrench CanadianGermanGerman RussianGhanaianGreekGuamanian/ChamorroGuatemalanGuyaneseHaitianHmongHonduranHopiHoumaHungarianIcelanderIndian (Asian)IndonesianInupiatIranianIraqiIrishIroquoisIsraeliItalianJamaicanJapaneseJordanianKenyanKiowaKoreanLaotianLatvianLiberianLithuanianLumbeeLuxembourgerMacedonianMalaysianMalteseMarshalleseMenomineeMexicanMexican American IndianMongolianMoroccanNative HawaiianNavajoNepaleseNew ZealanderNicaraguanNigerianNorthern EuropeanNorwegianOkinawanOsageOttawaPaiutePakistaniPalestinianPanamanianParaguayanPennsylvania GermanPeruvianPimaPolishPortuguesePotawatomiPuebloPuerto RicanPuget Sound SalishRomanianRussianSalvadoranSamoanScandinavianScotch-IrishScottishSeminoleSenegaleseSerbianShoshoneSierra LeoneanSiouxSlavicSlovakSloveneSomaliSouth AfricanSouth AmericanSouth American IndianSoviet UnionSpaniardSpanishSpanish AmericanSpanish American IndianSri LankanSubsaharan AfricanSudaneseSwedishSwissSyrianTaiwaneseThaiTlingit-HaidaTohono O'OdhamTonganTrinidadian and TobagonianTsimshianTurkishU.S. Virgin IslanderUgandanUkrainianUruguayanUteVenezuelanVietnameseWelshWest IndianYakamaYaquiYugoslavianYumanYup'ikZimbabwean
Immigration
NonimmigrantsImmigrantsAfghanistanAfricaAlbaniaArgentinaArmeniaAsiaAustraliaAustriaBahamasBangladeshBarbadosBelarusBelgiumBelizeBoliviaBosnia and HerzegovinaBrazilBulgariaBurma/MyanmarCabo VerdeCambodiaCameroonCanadaCaribbeanCentral AmericaChileChinaColombiaCongoCosta RicaCroatiaCubaCzechoslovakiaDenmarkDominicaDominican RepublicEastern AfricaEastern AsiaEastern EuropeEcuadorEgyptEl SalvadorEnglandEritreaEthiopiaEuropeFijiFranceGermanyGhanaGreeceGrenadaGuatemalaGuyanaHaitiHondurasHong KongHungaryIndiaIndonesiaIranIraqIrelandIsraelItalyJamaicaJapanJordanKazakhstanKenyaKoreaKuwaitLaosLatin AmericaLatviaLebanonLiberiaLithuaniaMalaysiaMexicoMicronesiaMiddle AfricaMoldovaMoroccoNepalNetherlandsNicaraguaNigeriaNorth AmericaNorth MacedoniaNorthern AfricaNorthern EuropeNorwayOceaniaPakistanPanamaPeruPhilippinesPolandPortugalRomaniaRussiaSaudi ArabiaScotlandSenegalSerbiaSierra LeoneSingaporeSomaliaSouth AfricaSouth AmericaSouth Central AsiaSouth Eastern AsiaSouthern EuropeSpainSri LankaSt. Vincent and the GrenadinesSudanSwedenSwitzerlandSyriaTaiwanThailandTrinidad and TobagoTurkeyUgandaUkraineUruguayUzbekistanVenezuelaVietnamWest IndiesWestern AfricaWestern AsiaWestern EuropeYemenZaireZimbabweAzores
Kindergarten
Income
Poverty
Unemployment
Labor Participation
Family Structure
Vehicle Availability
Education Level
Disability

Kindergarten Comparison

Lebanese

Luxembourgers

Exceptional
Exceptional
98.2%
KINDERGARTEN
93.5/ 100
METRIC RATING
126th/ 347
METRIC RANK
98.5%
KINDERGARTEN
99.9/ 100
METRIC RATING
40th/ 347
METRIC RANK

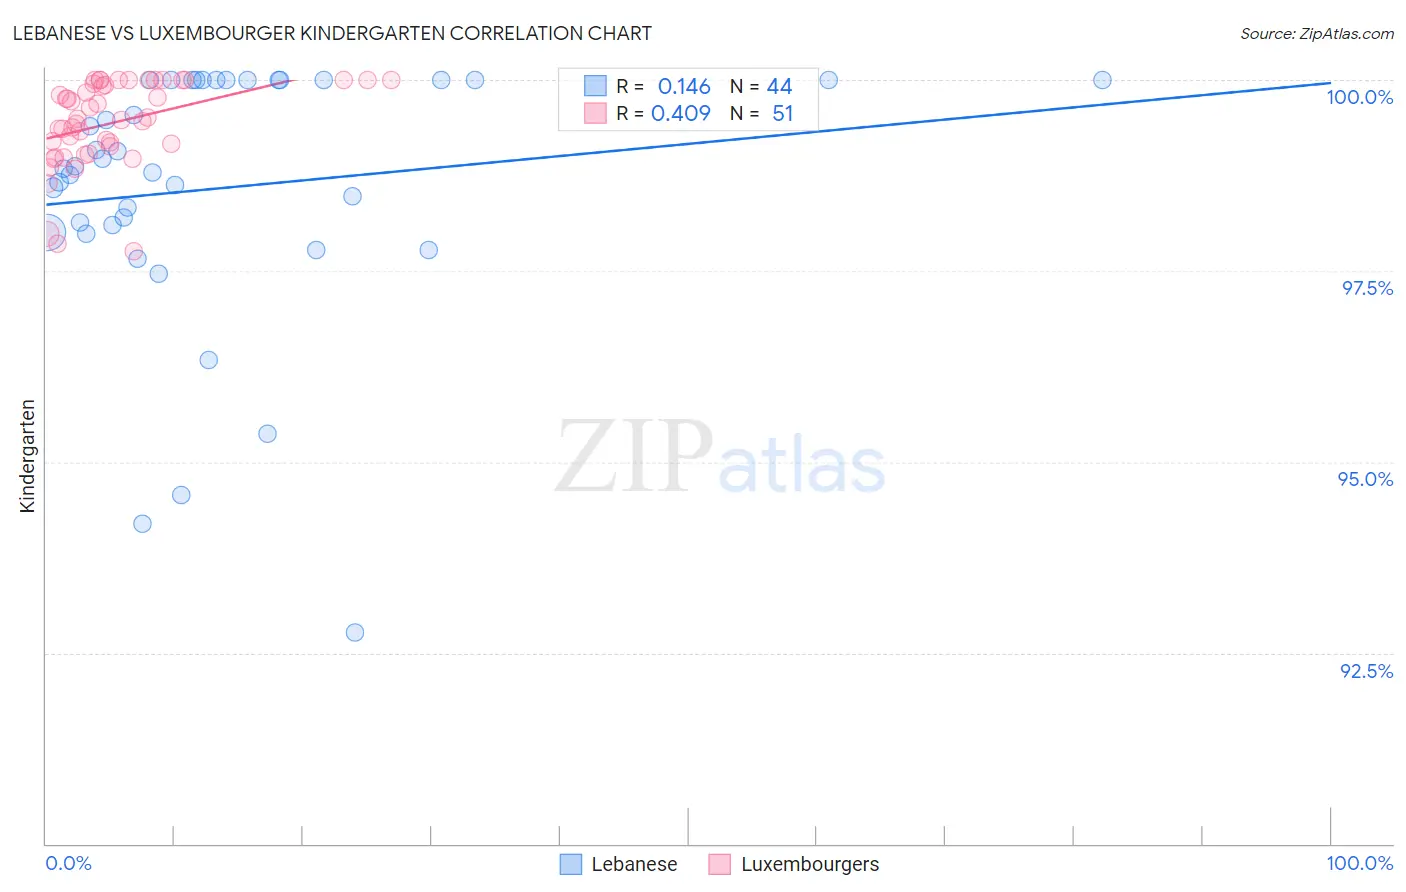
Lebanese vs Luxembourger Kindergarten Correlation Chart

The statistical analysis conducted on geographies consisting of 401,624,157 people shows a poor positive correlation between the proportion of Lebanese and percentage of population with at least kindergarten education in the United States with a correlation coefficient (R) of 0.146 and weighted average of 98.2%. Similarly, the statistical analysis conducted on geographies consisting of 144,675,804 people shows a moderate positive correlation between the proportion of Luxembourgers and percentage of population with at least kindergarten education in the United States with a correlation coefficient (R) of 0.409 and weighted average of 98.5%, a difference of 0.34%.
Lebanese vs Luxembourger Kindergarten

Kindergarten Correlation Summary

MeasurementLebaneseLuxembourger
Minimum92.8%97.8%
Maximum100.0%100.0%
Range7.2%2.2%
Mean98.6%99.4%
Median98.9%99.5%
Interquartile 25% (IQ1)98.1%99.1%
Interquartile 75% (IQ3)100.0%100.0%
Interquartile Range (IQR)1.9%0.87%
Standard Deviation (Sample)1.7%0.57%
Standard Deviation (Population)1.7%0.56%

Similar Demographics by Kindergarten

Demographics Similar to Lebanese by Kindergarten

In terms of kindergarten, the demographic groups most similar to Lebanese are Syrian (98.2%, a difference of 0.0%), Iroquois (98.2%, a difference of 0.0%), Immigrants from Saudi Arabia (98.1%, a difference of 0.0%), Okinawan (98.2%, a difference of 0.010%), and Immigrants from Zimbabwe (98.2%, a difference of 0.010%).
DemographicsRating | RankKindergarten
Thais
94.8
/100
|
#119
Exceptional
98.2%
Okinawans
94.4
/100
|
#120
Exceptional
98.2%
Immigrants | Zimbabwe
94.0
/100
|
#121
Exceptional
98.2%
Immigrants | Japan
94.0
/100
|
#122
Exceptional
98.2%
Menominee
93.9
/100
|
#123
Exceptional
98.2%
Syrians
93.6
/100
|
#124
Exceptional
98.2%
Iroquois
93.5
/100
|
#125
Exceptional
98.2%
Lebanese
93.5
/100
|
#126
Exceptional
98.2%
Immigrants | Saudi Arabia
93.1
/100
|
#127
Exceptional
98.1%
Immigrants | Serbia
92.4
/100
|
#128
Exceptional
98.1%
Seminole
91.5
/100
|
#129
Exceptional
98.1%
Immigrants | Croatia
91.2
/100
|
#130
Exceptional
98.1%
Cambodians
91.2
/100
|
#131
Exceptional
98.1%
Spaniards
91.0
/100
|
#132
Exceptional
98.1%
Immigrants | Europe
90.4
/100
|
#133
Exceptional
98.1%

Demographics Similar to Luxembourgers by Kindergarten

In terms of kindergarten, the demographic groups most similar to Luxembourgers are Eastern European (98.5%, a difference of 0.0%), Italian (98.5%, a difference of 0.010%), Latvian (98.5%, a difference of 0.010%), Chippewa (98.5%, a difference of 0.010%), and Native Hawaiian (98.5%, a difference of 0.010%).
DemographicsRating | RankKindergarten
Scandinavians
100.0
/100
|
#33
Exceptional
98.6%
Chinese
100.0
/100
|
#34
Exceptional
98.5%
Swiss
100.0
/100
|
#35
Exceptional
98.5%
British
99.9
/100
|
#36
Exceptional
98.5%
Italians
99.9
/100
|
#37
Exceptional
98.5%
Latvians
99.9
/100
|
#38
Exceptional
98.5%
Chippewa
99.9
/100
|
#39
Exceptional
98.5%
Luxembourgers
99.9
/100
|
#40
Exceptional
98.5%
Eastern Europeans
99.9
/100
|
#41
Exceptional
98.5%
Native Hawaiians
99.9
/100
|
#42
Exceptional
98.5%
Lumbee
99.9
/100
|
#43
Exceptional
98.5%
Northern Europeans
99.9
/100
|
#44
Exceptional
98.5%
Belgians
99.9
/100
|
#45
Exceptional
98.5%
Hungarians
99.9
/100
|
#46
Exceptional
98.5%
Czechoslovakians
99.8
/100
|
#47
Exceptional
98.4%