Latvian vs Guyanese 12th Grade, No Diploma
COMPARE
Latvian
Guyanese
12th Grade, No Diploma
12th Grade, No Diploma Comparison
Latvians
Guyanese
93.6%
12TH GRADE, NO DIPLOMA
100.0/ 100
METRIC RATING
9th/ 347
METRIC RANK
88.3%
12TH GRADE, NO DIPLOMA
0.0/ 100
METRIC RATING
294th/ 347
METRIC RANK
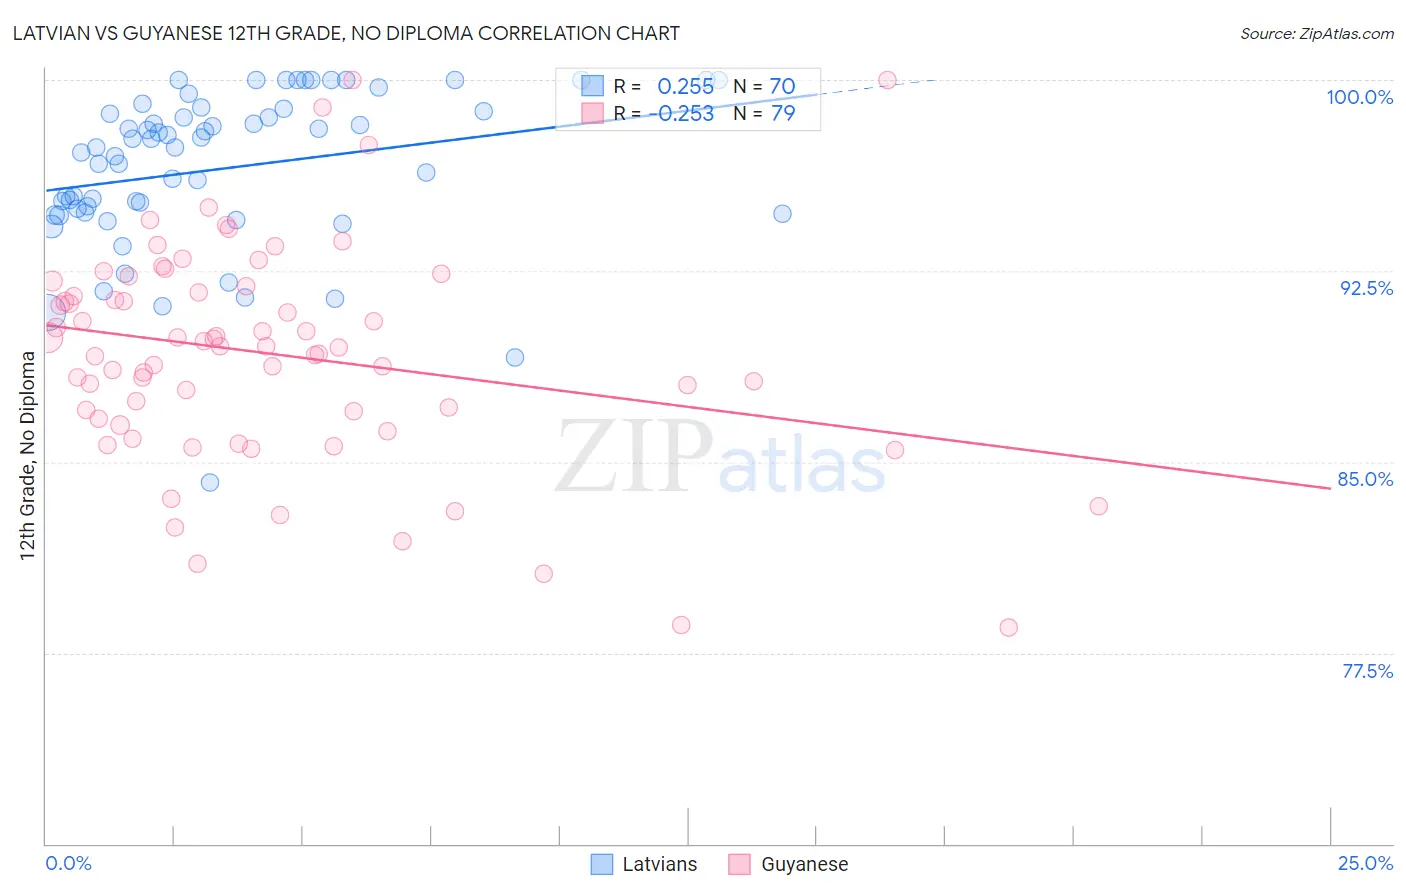
Latvian vs Guyanese 12th Grade, No Diploma Correlation Chart
The statistical analysis conducted on geographies consisting of 220,726,693 people shows a weak positive correlation between the proportion of Latvians and percentage of population with at least 12th grade (no diploma) education in the United States with a correlation coefficient (R) of 0.255 and weighted average of 93.6%. Similarly, the statistical analysis conducted on geographies consisting of 176,937,226 people shows a weak negative correlation between the proportion of Guyanese and percentage of population with at least 12th grade (no diploma) education in the United States with a correlation coefficient (R) of -0.253 and weighted average of 88.3%, a difference of 6.0%.
12th Grade, No Diploma Correlation Summary
| Measurement | Latvian | Guyanese |
| Minimum | 84.2% | 78.5% |
| Maximum | 100.0% | 100.0% |
| Range | 15.8% | 21.5% |
| Mean | 96.5% | 89.2% |
| Median | 97.3% | 89.5% |
| Interquartile 25% (IQ1) | 94.8% | 86.7% |
| Interquartile 75% (IQ3) | 98.8% | 91.9% |
| Interquartile Range (IQR) | 4.0% | 5.2% |
| Standard Deviation (Sample) | 3.1% | 4.3% |
| Standard Deviation (Population) | 3.1% | 4.3% |
Similar Demographics by 12th Grade, No Diploma
Demographics Similar to Latvians by 12th Grade, No Diploma
In terms of 12th grade, no diploma, the demographic groups most similar to Latvians are Slovak (93.6%, a difference of 0.010%), Chinese (93.6%, a difference of 0.010%), Croatian (93.5%, a difference of 0.020%), Immigrants from India (93.6%, a difference of 0.050%), and Slovene (93.6%, a difference of 0.070%).
| Demographics | Rating | Rank | 12th Grade, No Diploma |
| Swedes | 100.0 /100 | #2 | Exceptional 93.7% |
| Lithuanians | 100.0 /100 | #3 | Exceptional 93.6% |
| Slovenes | 100.0 /100 | #4 | Exceptional 93.6% |
| Carpatho Rusyns | 100.0 /100 | #5 | Exceptional 93.6% |
| Immigrants | India | 100.0 /100 | #6 | Exceptional 93.6% |
| Slovaks | 100.0 /100 | #7 | Exceptional 93.6% |
| Chinese | 100.0 /100 | #8 | Exceptional 93.6% |
| Latvians | 100.0 /100 | #9 | Exceptional 93.6% |
| Croatians | 100.0 /100 | #10 | Exceptional 93.5% |
| Poles | 100.0 /100 | #11 | Exceptional 93.5% |
| Eastern Europeans | 100.0 /100 | #12 | Exceptional 93.5% |
| Danes | 100.0 /100 | #13 | Exceptional 93.5% |
| Bulgarians | 100.0 /100 | #14 | Exceptional 93.5% |
| Finns | 100.0 /100 | #15 | Exceptional 93.4% |
| Maltese | 100.0 /100 | #16 | Exceptional 93.3% |
Demographics Similar to Guyanese by 12th Grade, No Diploma
In terms of 12th grade, no diploma, the demographic groups most similar to Guyanese are Immigrants (88.2%, a difference of 0.040%), Fijian (88.2%, a difference of 0.060%), Japanese (88.3%, a difference of 0.070%), Pueblo (88.2%, a difference of 0.070%), and Immigrants from Haiti (88.2%, a difference of 0.12%).
| Demographics | Rating | Rank | 12th Grade, No Diploma |
| Hopi | 0.0 /100 | #287 | Tragic 88.6% |
| Immigrants | Fiji | 0.0 /100 | #288 | Tragic 88.6% |
| Dutch West Indians | 0.0 /100 | #289 | Tragic 88.5% |
| British West Indians | 0.0 /100 | #290 | Tragic 88.5% |
| Haitians | 0.0 /100 | #291 | Tragic 88.5% |
| Immigrants | Grenada | 0.0 /100 | #292 | Tragic 88.4% |
| Japanese | 0.0 /100 | #293 | Tragic 88.3% |
| Guyanese | 0.0 /100 | #294 | Tragic 88.3% |
| Immigrants | Immigrants | 0.0 /100 | #295 | Tragic 88.2% |
| Fijians | 0.0 /100 | #296 | Tragic 88.2% |
| Pueblo | 0.0 /100 | #297 | Tragic 88.2% |
| Immigrants | Haiti | 0.0 /100 | #298 | Tragic 88.2% |
| Nepalese | 0.0 /100 | #299 | Tragic 88.1% |
| Immigrants | Guyana | 0.0 /100 | #300 | Tragic 88.1% |
| Immigrants | Cambodia | 0.0 /100 | #301 | Tragic 88.1% |