Laotian vs Immigrants from South Central Asia 7th Grade

COMPARE

Laotian
Race
Ancestry
AfghanAfricanAlaska NativeAlaskan AthabascanAlbanianAleutAlsatianAmericanApacheArabArapahoArgentineanArmenianAssyrian/Chaldean/SyriacAustralianAustrianBahamianBangladeshiBarbadianBasqueBelgianBelizeanBermudanBhutaneseBlackfeetBolivianBrazilianBritishBritish West IndianBulgarianBurmeseCajunCambodianCanadianCape VerdeanCarpatho RusynCelticCentral AmericanCentral American IndianCherokeeCheyenneChickasawChileanChineseChippewaChoctawColombianColvilleComancheCosta RicanCreeCreekCroatianCrowCubanCypriotCzechCzechoslovakianDanishDelawareDominicanDutchDutch West IndianEastern EuropeanEcuadorianEgyptianEnglishEstonianEthiopianEuropeanFijianFilipinoFinnishFrenchFrench American IndianFrench CanadianGermanGerman RussianGhanaianGreekGuamanian/ChamorroGuatemalanGuyaneseHaitianHmongHonduranHopiHoumaHungarianIcelanderIndian (Asian)IndonesianInupiatIranianIraqiIrishIroquoisIsraeliItalianJamaicanJapaneseJordanianKenyanKiowaKoreanLaotianLatvianLebaneseLiberianLithuanianLumbeeLuxembourgerMacedonianMalaysianMalteseMarshalleseMenomineeMexicanMexican American IndianMongolianMoroccanNative HawaiianNavajoNepaleseNew ZealanderNicaraguanNigerianNorthern EuropeanNorwegianOkinawanOsageOttawaPaiutePakistaniPalestinianPanamanianParaguayanPennsylvania GermanPeruvianPimaPolishPortuguesePotawatomiPuebloPuerto RicanPuget Sound SalishRomanianRussianSalvadoranSamoanScandinavianScotch-IrishScottishSeminoleSenegaleseSerbianShoshoneSierra LeoneanSiouxSlavicSlovakSloveneSomaliSouth AfricanSouth AmericanSouth American IndianSoviet UnionSpaniardSpanishSpanish AmericanSpanish American IndianSri LankanSubsaharan AfricanSudaneseSwedishSwissSyrianTaiwaneseThaiTlingit-HaidaTohono O'OdhamTonganTrinidadian and TobagonianTsimshianTurkishU.S. Virgin IslanderUgandanUkrainianUruguayanUteVenezuelanVietnameseWelshWest IndianYakamaYaquiYugoslavianYumanYup'ikZimbabwean
Immigration
NonimmigrantsImmigrantsAfghanistanAfricaAlbaniaArgentinaArmeniaAsiaAustraliaAustriaBahamasBangladeshBarbadosBelarusBelgiumBelizeBoliviaBosnia and HerzegovinaBrazilBulgariaBurma/MyanmarCabo VerdeCambodiaCameroonCanadaCaribbeanCentral AmericaChileChinaColombiaCongoCosta RicaCroatiaCubaCzechoslovakiaDenmarkDominicaDominican RepublicEastern AfricaEastern AsiaEastern EuropeEcuadorEgyptEl SalvadorEnglandEritreaEthiopiaEuropeFijiFranceGermanyGhanaGreeceGrenadaGuatemalaGuyanaHaitiHondurasHong KongHungaryIndiaIndonesiaIranIraqIrelandIsraelItalyJamaicaJapanJordanKazakhstanKenyaKoreaKuwaitLaosLatin AmericaLatviaLebanonLiberiaLithuaniaMalaysiaMexicoMicronesiaMiddle AfricaMoldovaMoroccoNepalNetherlandsNicaraguaNigeriaNorth AmericaNorth MacedoniaNorthern AfricaNorthern EuropeNorwayOceaniaPakistanPanamaPeruPhilippinesPolandPortugalRomaniaRussiaSaudi ArabiaScotlandSenegalSerbiaSierra LeoneSingaporeSomaliaSouth AfricaSouth AmericaSouth Eastern AsiaSouthern EuropeSpainSri LankaSt. Vincent and the GrenadinesSudanSwedenSwitzerlandSyriaTaiwanThailandTrinidad and TobagoTurkeyUgandaUkraineUruguayUzbekistanVenezuelaVietnamWest IndiesWestern AfricaWestern AsiaWestern EuropeYemenZaireZimbabweAzores
Immigrants from South Central Asia
Race
Ancestry
AfghanAfricanAlaska NativeAlaskan AthabascanAlbanianAleutAlsatianAmericanApacheArabArapahoArgentineanArmenianAssyrian/Chaldean/SyriacAustralianAustrianBahamianBangladeshiBarbadianBasqueBelgianBelizeanBermudanBhutaneseBlackfeetBolivianBrazilianBritishBritish West IndianBulgarianBurmeseCajunCambodianCanadianCape VerdeanCarpatho RusynCelticCentral AmericanCentral American IndianCherokeeCheyenneChickasawChileanChineseChippewaChoctawColombianColvilleComancheCosta RicanCreeCreekCroatianCrowCubanCypriotCzechCzechoslovakianDanishDelawareDominicanDutchDutch West IndianEastern EuropeanEcuadorianEgyptianEnglishEstonianEthiopianEuropeanFijianFilipinoFinnishFrenchFrench American IndianFrench CanadianGermanGerman RussianGhanaianGreekGuamanian/ChamorroGuatemalanGuyaneseHaitianHmongHonduranHopiHoumaHungarianIcelanderIndian (Asian)IndonesianInupiatIranianIraqiIrishIroquoisIsraeliItalianJamaicanJapaneseJordanianKenyanKiowaKoreanLatvianLebaneseLiberianLithuanianLumbeeLuxembourgerMacedonianMalaysianMalteseMarshalleseMenomineeMexicanMexican American IndianMongolianMoroccanNative HawaiianNavajoNepaleseNew ZealanderNicaraguanNigerianNorthern EuropeanNorwegianOkinawanOsageOttawaPaiutePakistaniPalestinianPanamanianParaguayanPennsylvania GermanPeruvianPimaPolishPortuguesePotawatomiPuebloPuerto RicanPuget Sound SalishRomanianRussianSalvadoranSamoanScandinavianScotch-IrishScottishSeminoleSenegaleseSerbianShoshoneSierra LeoneanSiouxSlavicSlovakSloveneSomaliSouth AfricanSouth AmericanSouth American IndianSoviet UnionSpaniardSpanishSpanish AmericanSpanish American IndianSri LankanSubsaharan AfricanSudaneseSwedishSwissSyrianTaiwaneseThaiTlingit-HaidaTohono O'OdhamTonganTrinidadian and TobagonianTsimshianTurkishU.S. Virgin IslanderUgandanUkrainianUruguayanUteVenezuelanVietnameseWelshWest IndianYakamaYaquiYugoslavianYumanYup'ikZimbabwean
Immigration
NonimmigrantsImmigrantsAfghanistanAfricaAlbaniaArgentinaArmeniaAsiaAustraliaAustriaBahamasBangladeshBarbadosBelarusBelgiumBelizeBoliviaBosnia and HerzegovinaBrazilBulgariaBurma/MyanmarCabo VerdeCambodiaCameroonCanadaCaribbeanCentral AmericaChileChinaColombiaCongoCosta RicaCroatiaCubaCzechoslovakiaDenmarkDominicaDominican RepublicEastern AfricaEastern AsiaEastern EuropeEcuadorEgyptEl SalvadorEnglandEritreaEthiopiaEuropeFijiFranceGermanyGhanaGreeceGrenadaGuatemalaGuyanaHaitiHondurasHong KongHungaryIndiaIndonesiaIranIraqIrelandIsraelItalyJamaicaJapanJordanKazakhstanKenyaKoreaKuwaitLaosLatin AmericaLatviaLebanonLiberiaLithuaniaMalaysiaMexicoMicronesiaMiddle AfricaMoldovaMoroccoNepalNetherlandsNicaraguaNigeriaNorth AmericaNorth MacedoniaNorthern AfricaNorthern EuropeNorwayOceaniaPakistanPanamaPeruPhilippinesPolandPortugalRomaniaRussiaSaudi ArabiaScotlandSenegalSerbiaSierra LeoneSingaporeSomaliaSouth AfricaSouth AmericaSouth Central AsiaSouth Eastern AsiaSouthern EuropeSpainSri LankaSt. Vincent and the GrenadinesSudanSwedenSwitzerlandSyriaTaiwanThailandTrinidad and TobagoTurkeyUgandaUkraineUruguayUzbekistanVenezuelaVietnamWest IndiesWestern AfricaWestern AsiaWestern EuropeYemenZaireZimbabweAzores
7th Grade
Income
Poverty
Unemployment
Labor Participation
Family Structure
Vehicle Availability
Education Level
Disability

7th Grade Comparison

Laotians

Immigrants from South Central Asia

Tragic
Excellent
95.7%
7TH GRADE
6.8/ 100
METRIC RATING
222nd/ 347
METRIC RANK
96.3%
7TH GRADE
87.1/ 100
METRIC RATING
141st/ 347
METRIC RANK

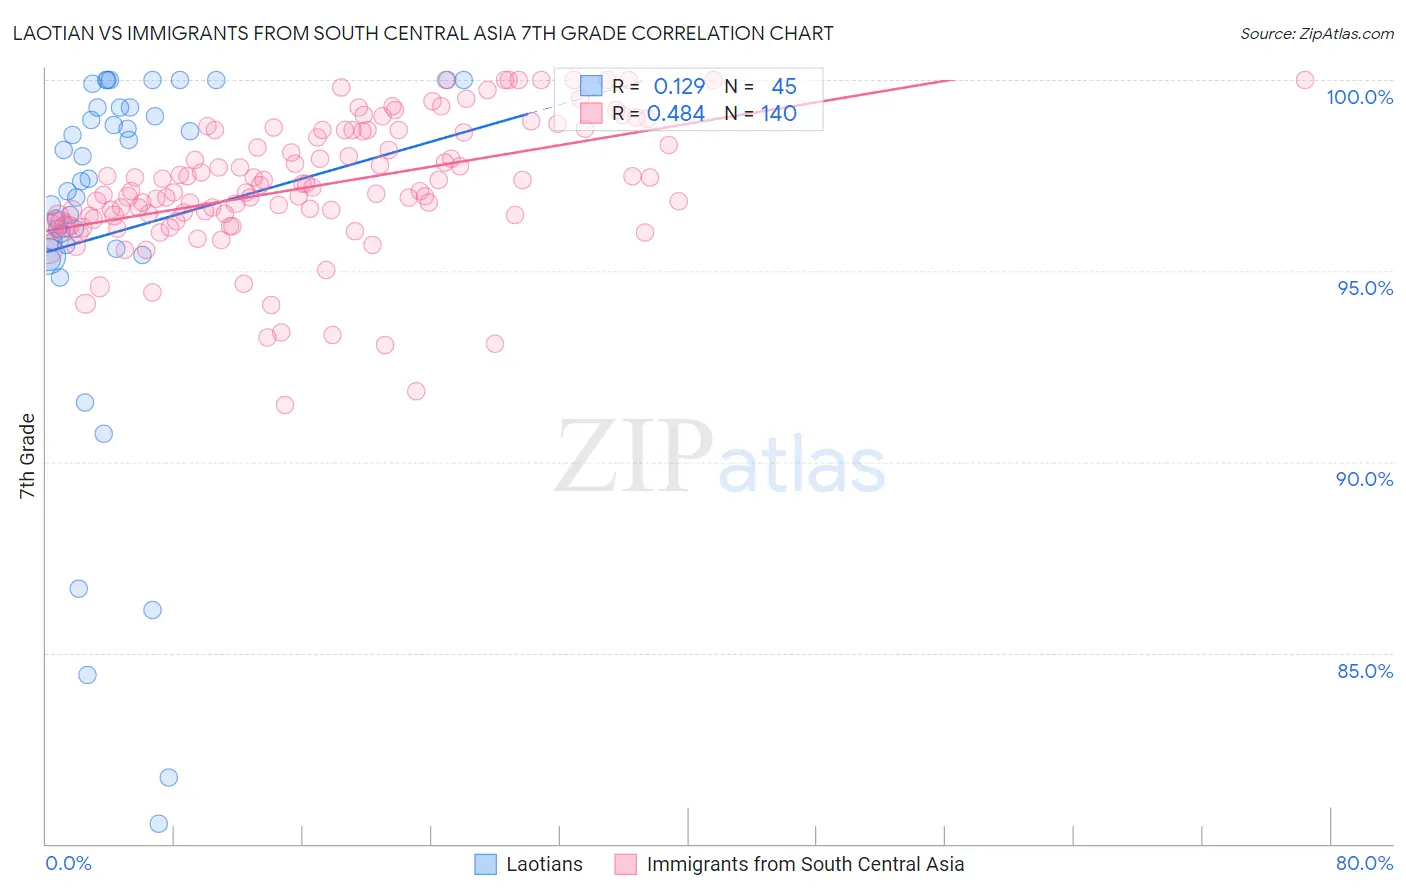
Laotian vs Immigrants from South Central Asia 7th Grade Correlation Chart

The statistical analysis conducted on geographies consisting of 224,856,886 people shows a poor positive correlation between the proportion of Laotians and percentage of population with at least 7th grade education in the United States with a correlation coefficient (R) of 0.129 and weighted average of 95.7%. Similarly, the statistical analysis conducted on geographies consisting of 473,113,181 people shows a moderate positive correlation between the proportion of Immigrants from South Central Asia and percentage of population with at least 7th grade education in the United States with a correlation coefficient (R) of 0.484 and weighted average of 96.3%, a difference of 0.70%.
Laotian vs Immigrants from South Central Asia 7th Grade

7th Grade Correlation Summary

MeasurementLaotianImmigrants from South Central Asia
Minimum80.5%91.5%
Maximum100.0%100.0%
Range19.5%8.5%
Mean96.0%97.2%
Median97.4%97.1%
Interquartile 25% (IQ1)95.5%96.3%
Interquartile 75% (IQ3)99.3%98.7%
Interquartile Range (IQR)3.8%2.3%
Standard Deviation (Sample)4.9%1.7%
Standard Deviation (Population)4.8%1.7%

Similar Demographics by 7th Grade

Demographics Similar to Laotians by 7th Grade

In terms of 7th grade, the demographic groups most similar to Laotians are Samoan (95.7%, a difference of 0.0%), Immigrants from Syria (95.7%, a difference of 0.0%), Immigrants from Oceania (95.7%, a difference of 0.0%), Subsaharan African (95.7%, a difference of 0.010%), and Immigrants from Southern Europe (95.7%, a difference of 0.020%).
DemographicsRating | Rank7th Grade
Spanish Americans
9.3
/100
|
#215
Tragic
95.7%
Immigrants | Chile
9.1
/100
|
#216
Tragic
95.7%
Immigrants | Pakistan
9.0
/100
|
#217
Tragic
95.7%
Immigrants | Liberia
8.1
/100
|
#218
Tragic
95.7%
Immigrants | Southern Europe
7.9
/100
|
#219
Tragic
95.7%
Sub-Saharan Africans
7.2
/100
|
#220
Tragic
95.7%
Samoans
7.0
/100
|
#221
Tragic
95.7%
Laotians
6.8
/100
|
#222
Tragic
95.7%
Immigrants | Syria
6.7
/100
|
#223
Tragic
95.7%
Immigrants | Oceania
6.7
/100
|
#224
Tragic
95.7%
Immigrants | Malaysia
6.2
/100
|
#225
Tragic
95.6%
Immigrants | Eastern Asia
5.8
/100
|
#226
Tragic
95.6%
Immigrants | Western Asia
5.4
/100
|
#227
Tragic
95.6%
Immigrants | Eastern Africa
5.1
/100
|
#228
Tragic
95.6%
Immigrants | Panama
4.9
/100
|
#229
Tragic
95.6%

Demographics Similar to Immigrants from South Central Asia by 7th Grade

In terms of 7th grade, the demographic groups most similar to Immigrants from South Central Asia are Burmese (96.3%, a difference of 0.0%), Spanish (96.3%, a difference of 0.010%), Cambodian (96.3%, a difference of 0.020%), Immigrants from Greece (96.3%, a difference of 0.020%), and Basque (96.4%, a difference of 0.030%).
DemographicsRating | Rank7th Grade
Soviet Union
91.2
/100
|
#134
Exceptional
96.4%
Immigrants | Kuwait
91.1
/100
|
#135
Exceptional
96.4%
Immigrants | Hungary
90.6
/100
|
#136
Exceptional
96.4%
Immigrants | Turkey
90.2
/100
|
#137
Exceptional
96.4%
Jordanians
90.0
/100
|
#138
Excellent
96.4%
Basques
89.3
/100
|
#139
Excellent
96.4%
Cambodians
88.3
/100
|
#140
Excellent
96.3%
Immigrants | South Central Asia
87.1
/100
|
#141
Excellent
96.3%
Burmese
87.1
/100
|
#142
Excellent
96.3%
Spanish
86.6
/100
|
#143
Excellent
96.3%
Immigrants | Greece
85.9
/100
|
#144
Excellent
96.3%
Blackfeet
83.9
/100
|
#145
Excellent
96.3%
Immigrants | Eastern Europe
83.7
/100
|
#146
Excellent
96.3%
French American Indians
83.1
/100
|
#147
Excellent
96.3%
Israelis
82.8
/100
|
#148
Excellent
96.3%