Korean vs Chilean Kindergarten

COMPARE

Korean
Race
Ancestry
AfghanAfricanAlaska NativeAlaskan AthabascanAlbanianAleutAlsatianAmericanApacheArabArapahoArgentineanArmenianAssyrian/Chaldean/SyriacAustralianAustrianBahamianBangladeshiBarbadianBasqueBelgianBelizeanBermudanBhutaneseBlackfeetBolivianBrazilianBritishBritish West IndianBulgarianBurmeseCajunCambodianCanadianCape VerdeanCarpatho RusynCelticCentral AmericanCentral American IndianCherokeeCheyenneChickasawChineseChippewaChoctawColombianColvilleComancheCosta RicanCreeCreekCroatianCrowCubanCypriotCzechCzechoslovakianDanishDelawareDominicanDutchDutch West IndianEastern EuropeanEcuadorianEgyptianEnglishEstonianEthiopianEuropeanFijianFilipinoFinnishFrenchFrench American IndianFrench CanadianGermanGerman RussianGhanaianGreekGuamanian/ChamorroGuatemalanGuyaneseHaitianHmongHonduranHopiHoumaHungarianIcelanderIndian (Asian)IndonesianInupiatIranianIraqiIrishIroquoisIsraeliItalianJamaicanJapaneseJordanianKenyanKiowaKoreanLaotianLatvianLebaneseLiberianLithuanianLumbeeLuxembourgerMacedonianMalaysianMalteseMarshalleseMenomineeMexicanMexican American IndianMongolianMoroccanNative HawaiianNavajoNepaleseNew ZealanderNicaraguanNigerianNorthern EuropeanNorwegianOkinawanOsageOttawaPaiutePakistaniPalestinianPanamanianParaguayanPennsylvania GermanPeruvianPimaPolishPortuguesePotawatomiPuebloPuerto RicanPuget Sound SalishRomanianRussianSalvadoranSamoanScandinavianScotch-IrishScottishSeminoleSenegaleseSerbianShoshoneSierra LeoneanSiouxSlavicSlovakSloveneSomaliSouth AfricanSouth AmericanSouth American IndianSoviet UnionSpaniardSpanishSpanish AmericanSpanish American IndianSri LankanSubsaharan AfricanSudaneseSwedishSwissSyrianTaiwaneseThaiTlingit-HaidaTohono O'OdhamTonganTrinidadian and TobagonianTsimshianTurkishU.S. Virgin IslanderUgandanUkrainianUruguayanUteVenezuelanVietnameseWelshWest IndianYakamaYaquiYugoslavianYumanYup'ikZimbabwean
Immigration
NonimmigrantsImmigrantsAfghanistanAfricaAlbaniaArgentinaArmeniaAsiaAustraliaAustriaBahamasBangladeshBarbadosBelarusBelgiumBelizeBoliviaBosnia and HerzegovinaBrazilBulgariaBurma/MyanmarCabo VerdeCambodiaCameroonCanadaCaribbeanCentral AmericaChileChinaColombiaCongoCosta RicaCroatiaCubaCzechoslovakiaDenmarkDominicaDominican RepublicEastern AfricaEastern AsiaEastern EuropeEcuadorEgyptEl SalvadorEnglandEritreaEthiopiaEuropeFijiFranceGermanyGhanaGreeceGrenadaGuatemalaGuyanaHaitiHondurasHong KongHungaryIndiaIndonesiaIranIraqIrelandIsraelItalyJamaicaJapanJordanKazakhstanKenyaKoreaKuwaitLaosLatin AmericaLatviaLebanonLiberiaLithuaniaMalaysiaMexicoMicronesiaMiddle AfricaMoldovaMoroccoNepalNetherlandsNicaraguaNigeriaNorth AmericaNorth MacedoniaNorthern AfricaNorthern EuropeNorwayOceaniaPakistanPanamaPeruPhilippinesPolandPortugalRomaniaRussiaSaudi ArabiaScotlandSenegalSerbiaSierra LeoneSingaporeSomaliaSouth AfricaSouth AmericaSouth Central AsiaSouth Eastern AsiaSouthern EuropeSpainSri LankaSt. Vincent and the GrenadinesSudanSwedenSwitzerlandSyriaTaiwanThailandTrinidad and TobagoTurkeyUgandaUkraineUruguayUzbekistanVenezuelaVietnamWest IndiesWestern AfricaWestern AsiaWestern EuropeYemenZaireZimbabweAzores
Chilean
Race
Ancestry
AfghanAfricanAlaska NativeAlaskan AthabascanAlbanianAleutAlsatianAmericanApacheArabArapahoArgentineanArmenianAssyrian/Chaldean/SyriacAustralianAustrianBahamianBangladeshiBarbadianBasqueBelgianBelizeanBermudanBhutaneseBlackfeetBolivianBrazilianBritishBritish West IndianBulgarianBurmeseCajunCambodianCanadianCape VerdeanCarpatho RusynCelticCentral AmericanCentral American IndianCherokeeCheyenneChickasawChileanChineseChippewaChoctawColombianColvilleComancheCosta RicanCreeCreekCroatianCrowCubanCypriotCzechCzechoslovakianDanishDelawareDominicanDutchDutch West IndianEastern EuropeanEcuadorianEgyptianEnglishEstonianEthiopianEuropeanFijianFilipinoFinnishFrenchFrench American IndianFrench CanadianGermanGerman RussianGhanaianGreekGuamanian/ChamorroGuatemalanGuyaneseHaitianHmongHonduranHopiHoumaHungarianIcelanderIndian (Asian)IndonesianInupiatIranianIraqiIrishIroquoisIsraeliItalianJamaicanJapaneseJordanianKenyanKiowaLaotianLatvianLebaneseLiberianLithuanianLumbeeLuxembourgerMacedonianMalaysianMalteseMarshalleseMenomineeMexicanMexican American IndianMongolianMoroccanNative HawaiianNavajoNepaleseNew ZealanderNicaraguanNigerianNorthern EuropeanNorwegianOkinawanOsageOttawaPaiutePakistaniPalestinianPanamanianParaguayanPennsylvania GermanPeruvianPimaPolishPortuguesePotawatomiPuebloPuerto RicanPuget Sound SalishRomanianRussianSalvadoranSamoanScandinavianScotch-IrishScottishSeminoleSenegaleseSerbianShoshoneSierra LeoneanSiouxSlavicSlovakSloveneSomaliSouth AfricanSouth AmericanSouth American IndianSoviet UnionSpaniardSpanishSpanish AmericanSpanish American IndianSri LankanSubsaharan AfricanSudaneseSwedishSwissSyrianTaiwaneseThaiTlingit-HaidaTohono O'OdhamTonganTrinidadian and TobagonianTsimshianTurkishU.S. Virgin IslanderUgandanUkrainianUruguayanUteVenezuelanVietnameseWelshWest IndianYakamaYaquiYugoslavianYumanYup'ikZimbabwean
Immigration
NonimmigrantsImmigrantsAfghanistanAfricaAlbaniaArgentinaArmeniaAsiaAustraliaAustriaBahamasBangladeshBarbadosBelarusBelgiumBelizeBoliviaBosnia and HerzegovinaBrazilBulgariaBurma/MyanmarCabo VerdeCambodiaCameroonCanadaCaribbeanCentral AmericaChileChinaColombiaCongoCosta RicaCroatiaCubaCzechoslovakiaDenmarkDominicaDominican RepublicEastern AfricaEastern AsiaEastern EuropeEcuadorEgyptEl SalvadorEnglandEritreaEthiopiaEuropeFijiFranceGermanyGhanaGreeceGrenadaGuatemalaGuyanaHaitiHondurasHong KongHungaryIndiaIndonesiaIranIraqIrelandIsraelItalyJamaicaJapanJordanKazakhstanKenyaKoreaKuwaitLaosLatin AmericaLatviaLebanonLiberiaLithuaniaMalaysiaMexicoMicronesiaMiddle AfricaMoldovaMoroccoNepalNetherlandsNicaraguaNigeriaNorth AmericaNorth MacedoniaNorthern AfricaNorthern EuropeNorwayOceaniaPakistanPanamaPeruPhilippinesPolandPortugalRomaniaRussiaSaudi ArabiaScotlandSenegalSerbiaSierra LeoneSingaporeSomaliaSouth AfricaSouth AmericaSouth Central AsiaSouth Eastern AsiaSouthern EuropeSpainSri LankaSt. Vincent and the GrenadinesSudanSwedenSwitzerlandSyriaTaiwanThailandTrinidad and TobagoTurkeyUgandaUkraineUruguayUzbekistanVenezuelaVietnamWest IndiesWestern AfricaWestern AsiaWestern EuropeYemenZaireZimbabweAzores
Kindergarten
Income
Poverty
Unemployment
Labor Participation
Family Structure
Vehicle Availability
Education Level
Disability

Kindergarten Comparison

Koreans

Chileans

Tragic
Average
97.6%
KINDERGARTEN
1.6/ 100
METRIC RATING
240th/ 347
METRIC RANK
98.0%
KINDERGARTEN
56.3/ 100
METRIC RATING
166th/ 347
METRIC RANK

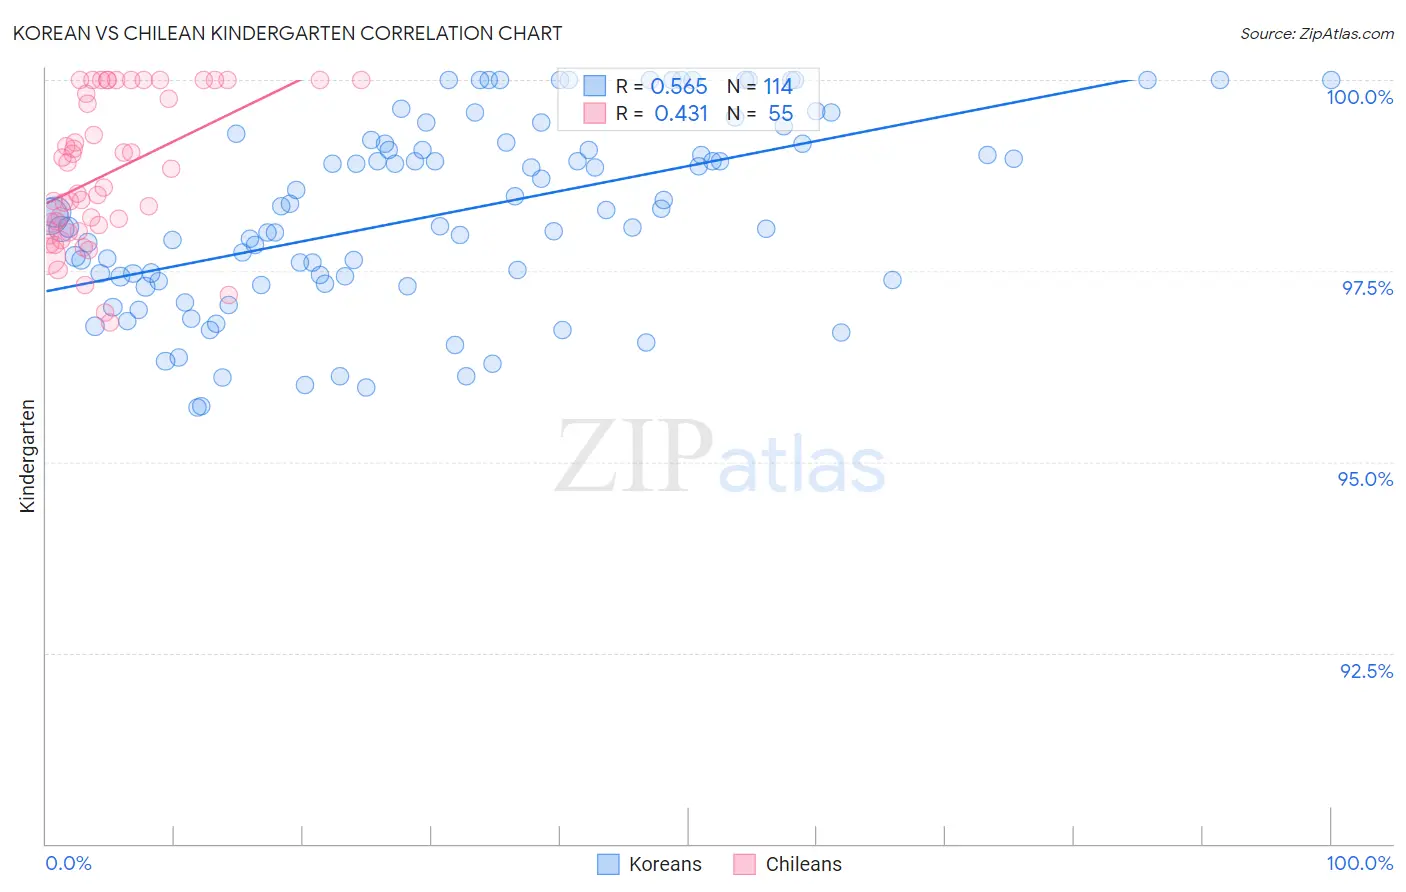
Korean vs Chilean Kindergarten Correlation Chart

The statistical analysis conducted on geographies consisting of 510,935,951 people shows a substantial positive correlation between the proportion of Koreans and percentage of population with at least kindergarten education in the United States with a correlation coefficient (R) of 0.565 and weighted average of 97.6%. Similarly, the statistical analysis conducted on geographies consisting of 256,684,337 people shows a moderate positive correlation between the proportion of Chileans and percentage of population with at least kindergarten education in the United States with a correlation coefficient (R) of 0.431 and weighted average of 98.0%, a difference of 0.34%.
Korean vs Chilean Kindergarten

Kindergarten Correlation Summary

MeasurementKoreanChilean
Minimum95.7%96.8%
Maximum100.0%100.0%
Range4.3%3.2%
Mean98.2%98.8%
Median98.2%98.6%
Interquartile 25% (IQ1)97.4%98.0%
Interquartile 75% (IQ3)99.2%100.0%
Interquartile Range (IQR)1.8%2.0%
Standard Deviation (Sample)1.2%0.95%
Standard Deviation (Population)1.2%0.94%

Similar Demographics by Kindergarten

Demographics Similar to Koreans by Kindergarten

In terms of kindergarten, the demographic groups most similar to Koreans are Nigerian (97.6%, a difference of 0.010%), Immigrants from Eastern Asia (97.6%, a difference of 0.010%), U.S. Virgin Islander (97.6%, a difference of 0.010%), Immigrants from Malaysia (97.7%, a difference of 0.020%), and Colombian (97.7%, a difference of 0.020%).
DemographicsRating | RankKindergarten
Immigrants | Pakistan
2.2
/100
|
#233
Tragic
97.7%
Immigrants | Malaysia
2.2
/100
|
#234
Tragic
97.7%
Colombians
2.2
/100
|
#235
Tragic
97.7%
Immigrants | Western Asia
2.1
/100
|
#236
Tragic
97.7%
Nigerians
1.8
/100
|
#237
Tragic
97.6%
Immigrants | Eastern Asia
1.7
/100
|
#238
Tragic
97.6%
U.S. Virgin Islanders
1.7
/100
|
#239
Tragic
97.6%
Koreans
1.6
/100
|
#240
Tragic
97.6%
Liberians
1.3
/100
|
#241
Tragic
97.6%
Immigrants | Indonesia
1.3
/100
|
#242
Tragic
97.6%
Asians
1.2
/100
|
#243
Tragic
97.6%
Bolivians
1.2
/100
|
#244
Tragic
97.6%
South Americans
1.1
/100
|
#245
Tragic
97.6%
Indians (Asian)
1.0
/100
|
#246
Tragic
97.6%
Immigrants | Eastern Africa
1.0
/100
|
#247
Tragic
97.6%

Demographics Similar to Chileans by Kindergarten

In terms of kindergarten, the demographic groups most similar to Chileans are Spanish American (98.0%, a difference of 0.0%), Immigrants from Micronesia (98.0%, a difference of 0.0%), Ugandan (98.0%, a difference of 0.0%), Immigrants from Russia (98.0%, a difference of 0.010%), and Immigrants from Eastern Europe (98.0%, a difference of 0.010%).
DemographicsRating | RankKindergarten
French American Indians
63.7
/100
|
#159
Good
98.0%
Immigrants | Russia
59.0
/100
|
#160
Average
98.0%
Immigrants | Eastern Europe
59.0
/100
|
#161
Average
98.0%
Immigrants | Italy
58.9
/100
|
#162
Average
98.0%
Spanish Americans
57.8
/100
|
#163
Average
98.0%
Immigrants | Micronesia
57.7
/100
|
#164
Average
98.0%
Ugandans
56.9
/100
|
#165
Average
98.0%
Chileans
56.3
/100
|
#166
Average
98.0%
Immigrants | Spain
54.6
/100
|
#167
Average
98.0%
Navajo
54.4
/100
|
#168
Average
98.0%
Immigrants | Korea
54.1
/100
|
#169
Average
98.0%
Bermudans
54.0
/100
|
#170
Average
98.0%
Immigrants | Jordan
54.0
/100
|
#171
Average
98.0%
Natives/Alaskans
51.0
/100
|
#172
Average
98.0%
Kenyans
51.0
/100
|
#173
Average
98.0%