Kenyan vs Ottawa 4th Grade

COMPARE

Kenyan
Race
Ancestry
AfghanAfricanAlaska NativeAlaskan AthabascanAlbanianAleutAlsatianAmericanApacheArabArapahoArgentineanArmenianAssyrian/Chaldean/SyriacAustralianAustrianBahamianBangladeshiBarbadianBasqueBelgianBelizeanBermudanBhutaneseBlackfeetBolivianBrazilianBritishBritish West IndianBulgarianBurmeseCajunCambodianCanadianCape VerdeanCarpatho RusynCelticCentral AmericanCentral American IndianCherokeeCheyenneChickasawChileanChineseChippewaChoctawColombianColvilleComancheCosta RicanCreeCreekCroatianCrowCubanCypriotCzechCzechoslovakianDanishDelawareDominicanDutchDutch West IndianEastern EuropeanEcuadorianEgyptianEnglishEstonianEthiopianEuropeanFijianFilipinoFinnishFrenchFrench American IndianFrench CanadianGermanGerman RussianGhanaianGreekGuamanian/ChamorroGuatemalanGuyaneseHaitianHmongHonduranHopiHoumaHungarianIcelanderIndian (Asian)IndonesianInupiatIranianIraqiIrishIroquoisIsraeliItalianJamaicanJapaneseJordanianKenyanKiowaKoreanLaotianLatvianLebaneseLiberianLithuanianLumbeeLuxembourgerMacedonianMalaysianMalteseMarshalleseMenomineeMexicanMexican American IndianMongolianMoroccanNative HawaiianNavajoNepaleseNew ZealanderNicaraguanNigerianNorthern EuropeanNorwegianOkinawanOsagePaiutePakistaniPalestinianPanamanianParaguayanPennsylvania GermanPeruvianPimaPolishPortuguesePotawatomiPuebloPuerto RicanPuget Sound SalishRomanianRussianSalvadoranSamoanScandinavianScotch-IrishScottishSeminoleSenegaleseSerbianShoshoneSierra LeoneanSiouxSlavicSlovakSloveneSomaliSouth AfricanSouth AmericanSouth American IndianSoviet UnionSpaniardSpanishSpanish AmericanSpanish American IndianSri LankanSubsaharan AfricanSudaneseSwedishSwissSyrianTaiwaneseThaiTlingit-HaidaTohono O'OdhamTonganTrinidadian and TobagonianTsimshianTurkishU.S. Virgin IslanderUgandanUkrainianUruguayanUteVenezuelanVietnameseWelshWest IndianYakamaYaquiYugoslavianYumanYup'ikZimbabwean
Immigration
NonimmigrantsImmigrantsAfghanistanAfricaAlbaniaArgentinaArmeniaAsiaAustraliaAustriaBahamasBangladeshBarbadosBelarusBelgiumBelizeBoliviaBosnia and HerzegovinaBrazilBulgariaBurma/MyanmarCabo VerdeCambodiaCameroonCanadaCaribbeanCentral AmericaChileChinaColombiaCongoCosta RicaCroatiaCubaCzechoslovakiaDenmarkDominicaDominican RepublicEastern AfricaEastern AsiaEastern EuropeEcuadorEgyptEl SalvadorEnglandEritreaEthiopiaEuropeFijiFranceGermanyGhanaGreeceGrenadaGuatemalaGuyanaHaitiHondurasHong KongHungaryIndiaIndonesiaIranIraqIrelandIsraelItalyJamaicaJapanJordanKazakhstanKenyaKoreaKuwaitLaosLatin AmericaLatviaLebanonLiberiaLithuaniaMalaysiaMexicoMicronesiaMiddle AfricaMoldovaMoroccoNepalNetherlandsNicaraguaNigeriaNorth AmericaNorth MacedoniaNorthern AfricaNorthern EuropeNorwayOceaniaPakistanPanamaPeruPhilippinesPolandPortugalRomaniaRussiaSaudi ArabiaScotlandSenegalSerbiaSierra LeoneSingaporeSomaliaSouth AfricaSouth AmericaSouth Central AsiaSouth Eastern AsiaSouthern EuropeSpainSri LankaSt. Vincent and the GrenadinesSudanSwedenSwitzerlandSyriaTaiwanThailandTrinidad and TobagoTurkeyUgandaUkraineUruguayUzbekistanVenezuelaVietnamWest IndiesWestern AfricaWestern AsiaWestern EuropeYemenZaireZimbabweAzores
Ottawa
Race
Ancestry
AfghanAfricanAlaska NativeAlaskan AthabascanAlbanianAleutAlsatianAmericanApacheArabArapahoArgentineanArmenianAssyrian/Chaldean/SyriacAustralianAustrianBahamianBangladeshiBarbadianBasqueBelgianBelizeanBermudanBhutaneseBlackfeetBolivianBrazilianBritishBritish West IndianBulgarianBurmeseCajunCambodianCanadianCape VerdeanCarpatho RusynCelticCentral AmericanCentral American IndianCherokeeCheyenneChickasawChileanChineseChippewaChoctawColombianColvilleComancheCosta RicanCreeCreekCroatianCrowCubanCypriotCzechCzechoslovakianDanishDelawareDominicanDutchDutch West IndianEastern EuropeanEcuadorianEgyptianEnglishEstonianEthiopianEuropeanFijianFilipinoFinnishFrenchFrench American IndianFrench CanadianGermanGerman RussianGhanaianGreekGuamanian/ChamorroGuatemalanGuyaneseHaitianHmongHonduranHopiHoumaHungarianIcelanderIndian (Asian)IndonesianInupiatIranianIraqiIrishIroquoisIsraeliItalianJamaicanJapaneseJordanianKiowaKoreanLaotianLatvianLebaneseLiberianLithuanianLumbeeLuxembourgerMacedonianMalaysianMalteseMarshalleseMenomineeMexicanMexican American IndianMongolianMoroccanNative HawaiianNavajoNepaleseNew ZealanderNicaraguanNigerianNorthern EuropeanNorwegianOkinawanOsageOttawaPaiutePakistaniPalestinianPanamanianParaguayanPennsylvania GermanPeruvianPimaPolishPortuguesePotawatomiPuebloPuerto RicanPuget Sound SalishRomanianRussianSalvadoranSamoanScandinavianScotch-IrishScottishSeminoleSenegaleseSerbianShoshoneSierra LeoneanSiouxSlavicSlovakSloveneSomaliSouth AfricanSouth AmericanSouth American IndianSoviet UnionSpaniardSpanishSpanish AmericanSpanish American IndianSri LankanSubsaharan AfricanSudaneseSwedishSwissSyrianTaiwaneseThaiTlingit-HaidaTohono O'OdhamTonganTrinidadian and TobagonianTsimshianTurkishU.S. Virgin IslanderUgandanUkrainianUruguayanUteVenezuelanVietnameseWelshWest IndianYakamaYaquiYugoslavianYumanYup'ikZimbabwean
Immigration
NonimmigrantsImmigrantsAfghanistanAfricaAlbaniaArgentinaArmeniaAsiaAustraliaAustriaBahamasBangladeshBarbadosBelarusBelgiumBelizeBoliviaBosnia and HerzegovinaBrazilBulgariaBurma/MyanmarCabo VerdeCambodiaCameroonCanadaCaribbeanCentral AmericaChileChinaColombiaCongoCosta RicaCroatiaCubaCzechoslovakiaDenmarkDominicaDominican RepublicEastern AfricaEastern AsiaEastern EuropeEcuadorEgyptEl SalvadorEnglandEritreaEthiopiaEuropeFijiFranceGermanyGhanaGreeceGrenadaGuatemalaGuyanaHaitiHondurasHong KongHungaryIndiaIndonesiaIranIraqIrelandIsraelItalyJamaicaJapanJordanKazakhstanKenyaKoreaKuwaitLaosLatin AmericaLatviaLebanonLiberiaLithuaniaMalaysiaMexicoMicronesiaMiddle AfricaMoldovaMoroccoNepalNetherlandsNicaraguaNigeriaNorth AmericaNorth MacedoniaNorthern AfricaNorthern EuropeNorwayOceaniaPakistanPanamaPeruPhilippinesPolandPortugalRomaniaRussiaSaudi ArabiaScotlandSenegalSerbiaSierra LeoneSingaporeSomaliaSouth AfricaSouth AmericaSouth Central AsiaSouth Eastern AsiaSouthern EuropeSpainSri LankaSt. Vincent and the GrenadinesSudanSwedenSwitzerlandSyriaTaiwanThailandTrinidad and TobagoTurkeyUgandaUkraineUruguayUzbekistanVenezuelaVietnamWest IndiesWestern AfricaWestern AsiaWestern EuropeYemenZaireZimbabweAzores
4th Grade
Income
Poverty
Unemployment
Labor Participation
Family Structure
Vehicle Availability
Education Level
Disability

4th Grade Comparison

Kenyans

Ottawa

Average
Exceptional
97.5%
4TH GRADE
56.5/ 100
METRIC RATING
166th/ 347
METRIC RANK
98.1%
4TH GRADE
99.9/ 100
METRIC RATING
46th/ 347
METRIC RANK

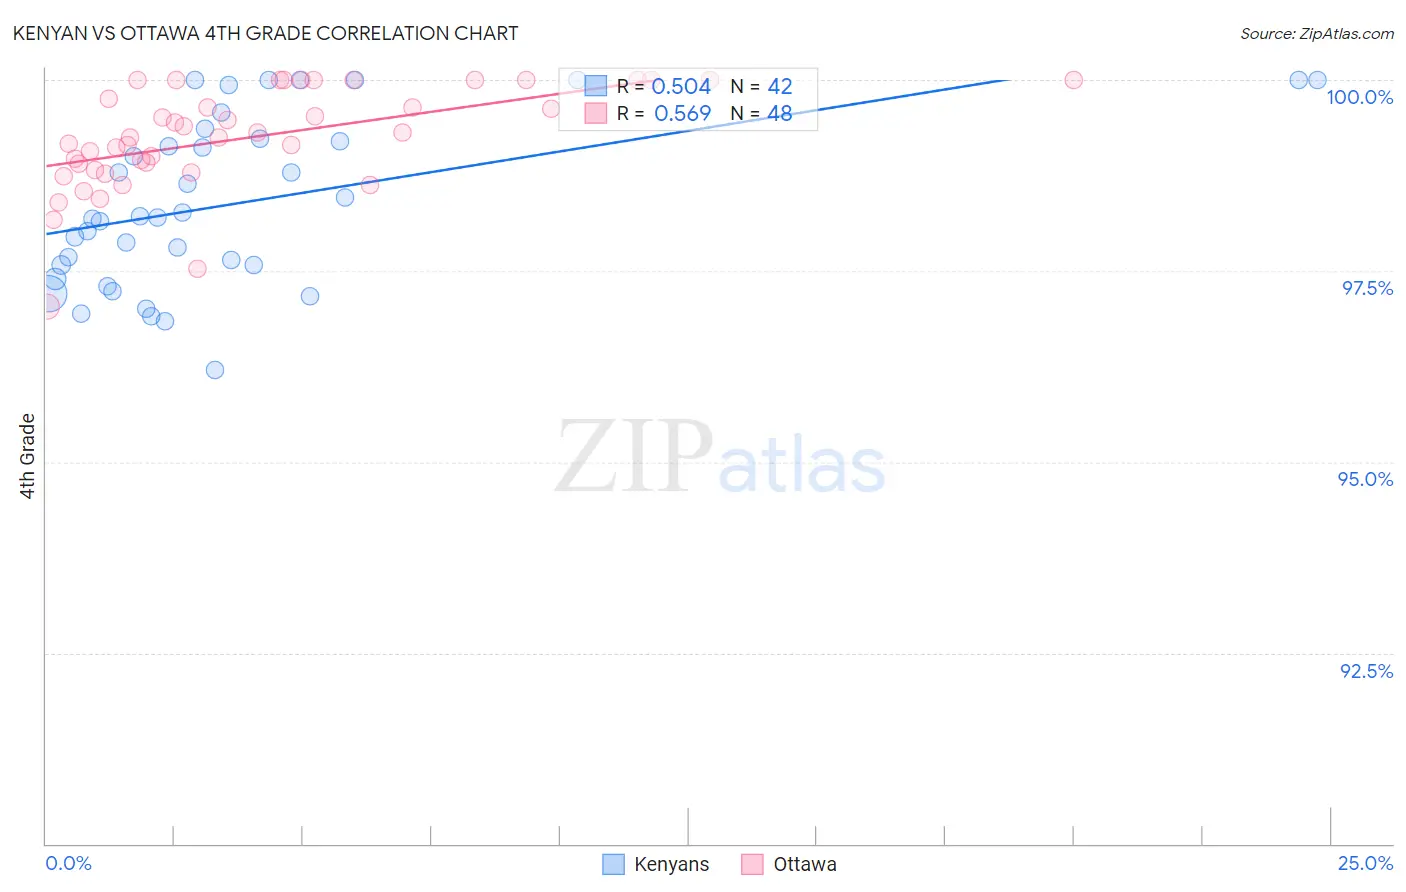
Kenyan vs Ottawa 4th Grade Correlation Chart

The statistical analysis conducted on geographies consisting of 168,244,481 people shows a substantial positive correlation between the proportion of Kenyans and percentage of population with at least 4th grade education in the United States with a correlation coefficient (R) of 0.504 and weighted average of 97.5%. Similarly, the statistical analysis conducted on geographies consisting of 49,956,726 people shows a substantial positive correlation between the proportion of Ottawa and percentage of population with at least 4th grade education in the United States with a correlation coefficient (R) of 0.569 and weighted average of 98.1%, a difference of 0.60%.
Kenyan vs Ottawa 4th Grade

4th Grade Correlation Summary

MeasurementKenyanOttawa
Minimum96.2%97.0%
Maximum100.0%100.0%
Range3.8%3.0%
Mean98.4%99.3%
Median98.2%99.3%
Interquartile 25% (IQ1)97.6%98.9%
Interquartile 75% (IQ3)99.2%100.0%
Interquartile Range (IQR)1.6%1.1%
Standard Deviation (Sample)1.1%0.67%
Standard Deviation (Population)1.1%0.67%

Similar Demographics by 4th Grade

Demographics Similar to Kenyans by 4th Grade

In terms of 4th grade, the demographic groups most similar to Kenyans are Immigrants from Poland (97.5%, a difference of 0.0%), Immigrants from Belarus (97.5%, a difference of 0.0%), Immigrants from Iran (97.6%, a difference of 0.010%), Ugandan (97.6%, a difference of 0.010%), and Venezuelan (97.6%, a difference of 0.010%).
DemographicsRating | Rank4th Grade
Immigrants | Italy
63.7
/100
|
#159
Good
97.6%
Apache
61.3
/100
|
#160
Good
97.6%
Marshallese
60.8
/100
|
#161
Good
97.6%
Bermudans
60.5
/100
|
#162
Good
97.6%
Immigrants | Iran
60.3
/100
|
#163
Good
97.6%
Ugandans
58.9
/100
|
#164
Average
97.6%
Venezuelans
58.7
/100
|
#165
Average
97.6%
Kenyans
56.5
/100
|
#166
Average
97.5%
Immigrants | Poland
55.9
/100
|
#167
Average
97.5%
Immigrants | Belarus
55.8
/100
|
#168
Average
97.5%
Chileans
54.4
/100
|
#169
Average
97.5%
Immigrants | Spain
51.8
/100
|
#170
Average
97.5%
Brazilians
51.5
/100
|
#171
Average
97.5%
Immigrants | Sri Lanka
51.1
/100
|
#172
Average
97.5%
Immigrants | Korea
50.6
/100
|
#173
Average
97.5%

Demographics Similar to Ottawa by 4th Grade

In terms of 4th grade, the demographic groups most similar to Ottawa are Czechoslovakian (98.1%, a difference of 0.0%), Arapaho (98.1%, a difference of 0.0%), Native Hawaiian (98.1%, a difference of 0.020%), Estonian (98.1%, a difference of 0.020%), and Bulgarian (98.1%, a difference of 0.020%).
DemographicsRating | Rank4th Grade
Belgians
99.9
/100
|
#39
Exceptional
98.2%
Luxembourgers
99.9
/100
|
#40
Exceptional
98.2%
Eastern Europeans
99.9
/100
|
#41
Exceptional
98.2%
Hungarians
99.9
/100
|
#42
Exceptional
98.2%
Northern Europeans
99.9
/100
|
#43
Exceptional
98.2%
Native Hawaiians
99.9
/100
|
#44
Exceptional
98.1%
Czechoslovakians
99.9
/100
|
#45
Exceptional
98.1%
Ottawa
99.9
/100
|
#46
Exceptional
98.1%
Arapaho
99.9
/100
|
#47
Exceptional
98.1%
Estonians
99.8
/100
|
#48
Exceptional
98.1%
Bulgarians
99.8
/100
|
#49
Exceptional
98.1%
Immigrants | Scotland
99.8
/100
|
#50
Exceptional
98.1%
Celtics
99.8
/100
|
#51
Exceptional
98.1%
Australians
99.8
/100
|
#52
Exceptional
98.1%
Slavs
99.8
/100
|
#53
Exceptional
98.1%