Kenyan vs Delaware 6th Grade

COMPARE

Kenyan
Race
Ancestry
AfghanAfricanAlaska NativeAlaskan AthabascanAlbanianAleutAlsatianAmericanApacheArabArapahoArgentineanArmenianAssyrian/Chaldean/SyriacAustralianAustrianBahamianBangladeshiBarbadianBasqueBelgianBelizeanBermudanBhutaneseBlackfeetBolivianBrazilianBritishBritish West IndianBulgarianBurmeseCajunCambodianCanadianCape VerdeanCarpatho RusynCelticCentral AmericanCentral American IndianCherokeeCheyenneChickasawChileanChineseChippewaChoctawColombianColvilleComancheCosta RicanCreeCreekCroatianCrowCubanCypriotCzechCzechoslovakianDanishDominicanDutchDutch West IndianEastern EuropeanEcuadorianEgyptianEnglishEstonianEthiopianEuropeanFijianFilipinoFinnishFrenchFrench American IndianFrench CanadianGermanGerman RussianGhanaianGreekGuamanian/ChamorroGuatemalanGuyaneseHaitianHmongHonduranHopiHoumaHungarianIcelanderIndian (Asian)IndonesianInupiatIranianIraqiIrishIroquoisIsraeliItalianJamaicanJapaneseJordanianKenyanKiowaKoreanLaotianLatvianLebaneseLiberianLithuanianLumbeeLuxembourgerMacedonianMalaysianMalteseMarshalleseMenomineeMexicanMexican American IndianMongolianMoroccanNative HawaiianNavajoNepaleseNew ZealanderNicaraguanNigerianNorthern EuropeanNorwegianOkinawanOsageOttawaPaiutePakistaniPalestinianPanamanianParaguayanPennsylvania GermanPeruvianPimaPolishPortuguesePotawatomiPuebloPuerto RicanPuget Sound SalishRomanianRussianSalvadoranSamoanScandinavianScotch-IrishScottishSeminoleSenegaleseSerbianShoshoneSierra LeoneanSiouxSlavicSlovakSloveneSomaliSouth AfricanSouth AmericanSouth American IndianSoviet UnionSpaniardSpanishSpanish AmericanSpanish American IndianSri LankanSubsaharan AfricanSudaneseSwedishSwissSyrianTaiwaneseThaiTlingit-HaidaTohono O'OdhamTonganTrinidadian and TobagonianTsimshianTurkishU.S. Virgin IslanderUgandanUkrainianUruguayanUteVenezuelanVietnameseWelshWest IndianYakamaYaquiYugoslavianYumanYup'ikZimbabwean
Immigration
NonimmigrantsImmigrantsAfghanistanAfricaAlbaniaArgentinaArmeniaAsiaAustraliaAustriaBahamasBangladeshBarbadosBelarusBelgiumBelizeBoliviaBosnia and HerzegovinaBrazilBulgariaBurma/MyanmarCabo VerdeCambodiaCameroonCanadaCaribbeanCentral AmericaChileChinaColombiaCongoCosta RicaCroatiaCubaCzechoslovakiaDenmarkDominicaDominican RepublicEastern AfricaEastern AsiaEastern EuropeEcuadorEgyptEl SalvadorEnglandEritreaEthiopiaEuropeFijiFranceGermanyGhanaGreeceGrenadaGuatemalaGuyanaHaitiHondurasHong KongHungaryIndiaIndonesiaIranIraqIrelandIsraelItalyJamaicaJapanJordanKazakhstanKenyaKoreaKuwaitLaosLatin AmericaLatviaLebanonLiberiaLithuaniaMalaysiaMexicoMicronesiaMiddle AfricaMoldovaMoroccoNepalNetherlandsNicaraguaNigeriaNorth AmericaNorth MacedoniaNorthern AfricaNorthern EuropeNorwayOceaniaPakistanPanamaPeruPhilippinesPolandPortugalRomaniaRussiaSaudi ArabiaScotlandSenegalSerbiaSierra LeoneSingaporeSomaliaSouth AfricaSouth AmericaSouth Central AsiaSouth Eastern AsiaSouthern EuropeSpainSri LankaSt. Vincent and the GrenadinesSudanSwedenSwitzerlandSyriaTaiwanThailandTrinidad and TobagoTurkeyUgandaUkraineUruguayUzbekistanVenezuelaVietnamWest IndiesWestern AfricaWestern AsiaWestern EuropeYemenZaireZimbabweAzores
Delaware
Race
Ancestry
AfghanAfricanAlaska NativeAlaskan AthabascanAlbanianAleutAlsatianAmericanApacheArabArapahoArgentineanArmenianAssyrian/Chaldean/SyriacAustralianAustrianBahamianBangladeshiBarbadianBasqueBelgianBelizeanBermudanBhutaneseBlackfeetBolivianBrazilianBritishBritish West IndianBulgarianBurmeseCajunCambodianCanadianCape VerdeanCarpatho RusynCelticCentral AmericanCentral American IndianCherokeeCheyenneChickasawChileanChineseChippewaChoctawColombianColvilleComancheCosta RicanCreeCreekCroatianCrowCubanCypriotCzechCzechoslovakianDanishDelawareDominicanDutchDutch West IndianEastern EuropeanEcuadorianEgyptianEnglishEstonianEthiopianEuropeanFijianFilipinoFinnishFrenchFrench American IndianFrench CanadianGermanGerman RussianGhanaianGreekGuamanian/ChamorroGuatemalanGuyaneseHaitianHmongHonduranHopiHoumaHungarianIcelanderIndian (Asian)IndonesianInupiatIranianIraqiIrishIroquoisIsraeliItalianJamaicanJapaneseJordanianKiowaKoreanLaotianLatvianLebaneseLiberianLithuanianLumbeeLuxembourgerMacedonianMalaysianMalteseMarshalleseMenomineeMexicanMexican American IndianMongolianMoroccanNative HawaiianNavajoNepaleseNew ZealanderNicaraguanNigerianNorthern EuropeanNorwegianOkinawanOsageOttawaPaiutePakistaniPalestinianPanamanianParaguayanPennsylvania GermanPeruvianPimaPolishPortuguesePotawatomiPuebloPuerto RicanPuget Sound SalishRomanianRussianSalvadoranSamoanScandinavianScotch-IrishScottishSeminoleSenegaleseSerbianShoshoneSierra LeoneanSiouxSlavicSlovakSloveneSomaliSouth AfricanSouth AmericanSouth American IndianSoviet UnionSpaniardSpanishSpanish AmericanSpanish American IndianSri LankanSubsaharan AfricanSudaneseSwedishSwissSyrianTaiwaneseThaiTlingit-HaidaTohono O'OdhamTonganTrinidadian and TobagonianTsimshianTurkishU.S. Virgin IslanderUgandanUkrainianUruguayanUteVenezuelanVietnameseWelshWest IndianYakamaYaquiYugoslavianYumanYup'ikZimbabwean
Immigration
NonimmigrantsImmigrantsAfghanistanAfricaAlbaniaArgentinaArmeniaAsiaAustraliaAustriaBahamasBangladeshBarbadosBelarusBelgiumBelizeBoliviaBosnia and HerzegovinaBrazilBulgariaBurma/MyanmarCabo VerdeCambodiaCameroonCanadaCaribbeanCentral AmericaChileChinaColombiaCongoCosta RicaCroatiaCubaCzechoslovakiaDenmarkDominicaDominican RepublicEastern AfricaEastern AsiaEastern EuropeEcuadorEgyptEl SalvadorEnglandEritreaEthiopiaEuropeFijiFranceGermanyGhanaGreeceGrenadaGuatemalaGuyanaHaitiHondurasHong KongHungaryIndiaIndonesiaIranIraqIrelandIsraelItalyJamaicaJapanJordanKazakhstanKenyaKoreaKuwaitLaosLatin AmericaLatviaLebanonLiberiaLithuaniaMalaysiaMexicoMicronesiaMiddle AfricaMoldovaMoroccoNepalNetherlandsNicaraguaNigeriaNorth AmericaNorth MacedoniaNorthern AfricaNorthern EuropeNorwayOceaniaPakistanPanamaPeruPhilippinesPolandPortugalRomaniaRussiaSaudi ArabiaScotlandSenegalSerbiaSierra LeoneSingaporeSomaliaSouth AfricaSouth AmericaSouth Central AsiaSouth Eastern AsiaSouthern EuropeSpainSri LankaSt. Vincent and the GrenadinesSudanSwedenSwitzerlandSyriaTaiwanThailandTrinidad and TobagoTurkeyUgandaUkraineUruguayUzbekistanVenezuelaVietnamWest IndiesWestern AfricaWestern AsiaWestern EuropeYemenZaireZimbabweAzores
6th Grade
Income
Poverty
Unemployment
Labor Participation
Family Structure
Vehicle Availability
Education Level
Disability

6th Grade Comparison

Kenyans

Delaware

Good
Exceptional
97.1%
6TH GRADE
62.9/ 100
METRIC RATING
159th/ 347
METRIC RANK
97.6%
6TH GRADE
98.9/ 100
METRIC RATING
85th/ 347
METRIC RANK

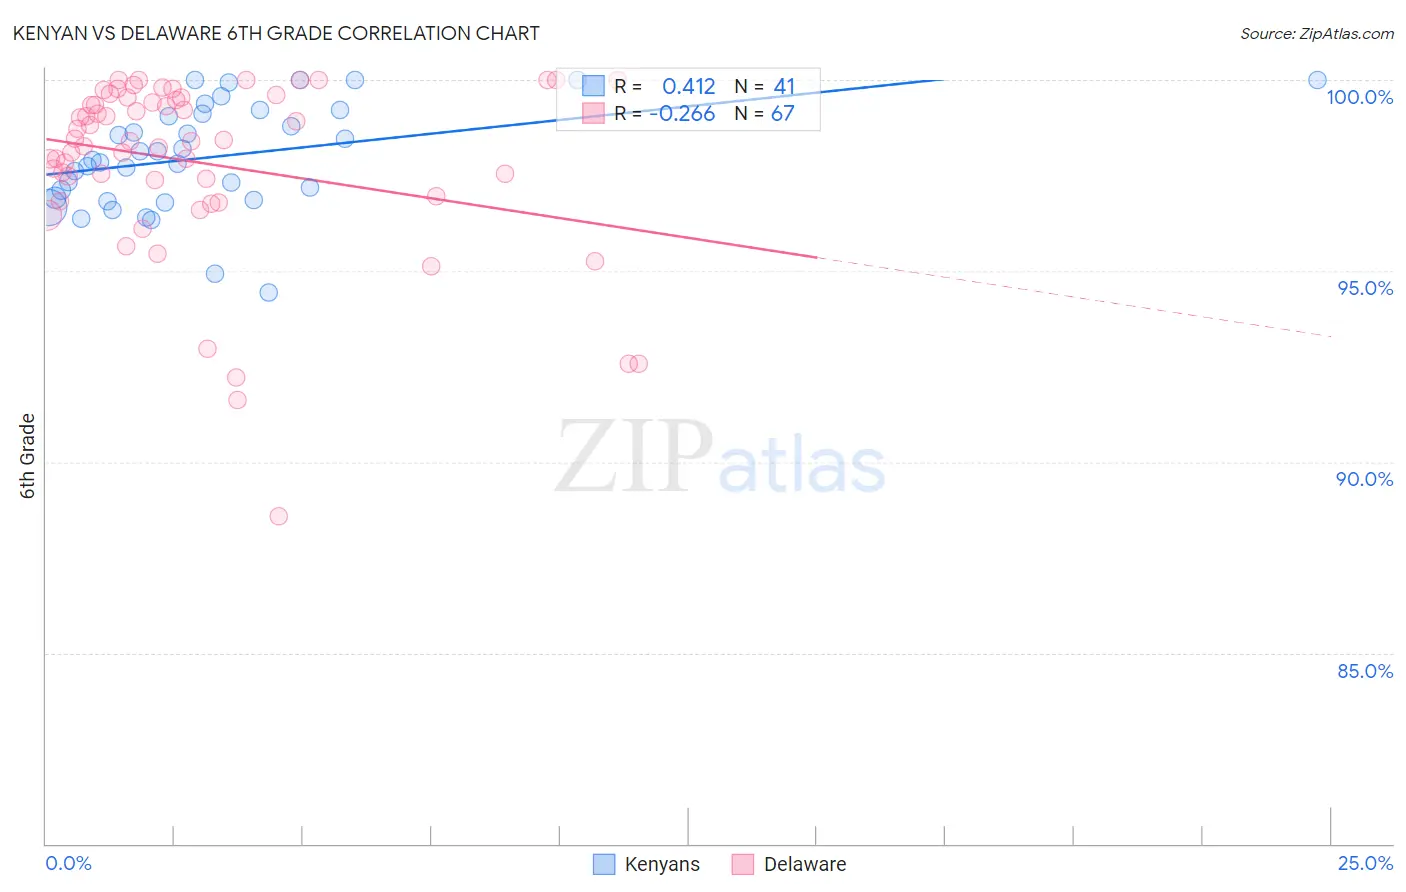
Kenyan vs Delaware 6th Grade Correlation Chart

The statistical analysis conducted on geographies consisting of 168,244,042 people shows a moderate positive correlation between the proportion of Kenyans and percentage of population with at least 6th grade education in the United States with a correlation coefficient (R) of 0.412 and weighted average of 97.1%. Similarly, the statistical analysis conducted on geographies consisting of 96,235,191 people shows a weak negative correlation between the proportion of Delaware and percentage of population with at least 6th grade education in the United States with a correlation coefficient (R) of -0.266 and weighted average of 97.6%, a difference of 0.46%.
Kenyan vs Delaware 6th Grade

6th Grade Correlation Summary

MeasurementKenyanDelaware
Minimum94.4%88.6%
Maximum100.0%100.0%
Range5.6%11.4%
Mean98.0%97.8%
Median97.9%98.4%
Interquartile 25% (IQ1)96.9%97.0%
Interquartile 75% (IQ3)99.2%99.5%
Interquartile Range (IQR)2.3%2.6%
Standard Deviation (Sample)1.4%2.4%
Standard Deviation (Population)1.4%2.3%

Similar Demographics by 6th Grade

Demographics Similar to Kenyans by 6th Grade

In terms of 6th grade, the demographic groups most similar to Kenyans are Immigrants from Iran (97.1%, a difference of 0.0%), Ugandan (97.1%, a difference of 0.0%), Immigrants from Belarus (97.1%, a difference of 0.010%), Marshallese (97.1%, a difference of 0.010%), and Immigrants from Russia (97.1%, a difference of 0.020%).
DemographicsRating | Rank6th Grade
Immigrants | Jordan
73.0
/100
|
#152
Good
97.2%
Immigrants | Eastern Europe
72.6
/100
|
#153
Good
97.2%
Soviet Union
71.5
/100
|
#154
Good
97.2%
Ute
71.1
/100
|
#155
Good
97.1%
Alsatians
69.8
/100
|
#156
Good
97.1%
Immigrants | Russia
67.6
/100
|
#157
Good
97.1%
Immigrants | Iran
63.3
/100
|
#158
Good
97.1%
Kenyans
62.9
/100
|
#159
Good
97.1%
Ugandans
62.2
/100
|
#160
Good
97.1%
Immigrants | Belarus
60.4
/100
|
#161
Good
97.1%
Marshallese
60.2
/100
|
#162
Good
97.1%
Albanians
57.8
/100
|
#163
Average
97.1%
Immigrants | Korea
57.7
/100
|
#164
Average
97.1%
Immigrants | Poland
56.2
/100
|
#165
Average
97.1%
Immigrants | Italy
53.8
/100
|
#166
Average
97.1%

Demographics Similar to Delaware by 6th Grade

In terms of 6th grade, the demographic groups most similar to Delaware are Shoshone (97.6%, a difference of 0.010%), Immigrants from Belgium (97.5%, a difference of 0.010%), Puget Sound Salish (97.5%, a difference of 0.010%), Immigrants from South Africa (97.5%, a difference of 0.010%), and Immigrants from Australia (97.5%, a difference of 0.010%).
DemographicsRating | Rank6th Grade
Icelanders
99.3
/100
|
#78
Exceptional
97.6%
Immigrants | India
99.3
/100
|
#79
Exceptional
97.6%
Osage
99.3
/100
|
#80
Exceptional
97.6%
Lumbee
99.2
/100
|
#81
Exceptional
97.6%
Zimbabweans
99.1
/100
|
#82
Exceptional
97.6%
Potawatomi
99.1
/100
|
#83
Exceptional
97.6%
Shoshone
99.0
/100
|
#84
Exceptional
97.6%
Delaware
98.9
/100
|
#85
Exceptional
97.6%
Immigrants | Belgium
98.9
/100
|
#86
Exceptional
97.5%
Puget Sound Salish
98.9
/100
|
#87
Exceptional
97.5%
Immigrants | South Africa
98.9
/100
|
#88
Exceptional
97.5%
Immigrants | Australia
98.8
/100
|
#89
Exceptional
97.5%
Pueblo
98.8
/100
|
#90
Exceptional
97.5%
Immigrants | Western Europe
98.8
/100
|
#91
Exceptional
97.5%
Romanians
98.7
/100
|
#92
Exceptional
97.5%