Jordanian vs Immigrants from Australia 8th Grade

COMPARE

Jordanian
Race
Ancestry
AfghanAfricanAlaska NativeAlaskan AthabascanAlbanianAleutAlsatianAmericanApacheArabArapahoArgentineanArmenianAssyrian/Chaldean/SyriacAustralianAustrianBahamianBangladeshiBarbadianBasqueBelgianBelizeanBermudanBhutaneseBlackfeetBolivianBrazilianBritishBritish West IndianBulgarianBurmeseCajunCambodianCanadianCape VerdeanCarpatho RusynCelticCentral AmericanCentral American IndianCherokeeCheyenneChickasawChileanChineseChippewaChoctawColombianColvilleComancheCosta RicanCreeCreekCroatianCrowCubanCypriotCzechCzechoslovakianDanishDelawareDominicanDutchDutch West IndianEastern EuropeanEcuadorianEgyptianEnglishEstonianEthiopianEuropeanFijianFilipinoFinnishFrenchFrench American IndianFrench CanadianGermanGerman RussianGhanaianGreekGuamanian/ChamorroGuatemalanGuyaneseHaitianHmongHonduranHopiHoumaHungarianIcelanderIndian (Asian)IndonesianInupiatIranianIraqiIrishIroquoisIsraeliItalianJamaicanJapaneseJordanianKenyanKiowaKoreanLaotianLatvianLebaneseLiberianLithuanianLumbeeLuxembourgerMacedonianMalaysianMalteseMarshalleseMenomineeMexicanMexican American IndianMongolianMoroccanNative HawaiianNavajoNepaleseNew ZealanderNicaraguanNigerianNorthern EuropeanNorwegianOkinawanOsageOttawaPaiutePakistaniPalestinianPanamanianParaguayanPennsylvania GermanPeruvianPimaPolishPortuguesePotawatomiPuebloPuerto RicanPuget Sound SalishRomanianRussianSalvadoranSamoanScandinavianScotch-IrishScottishSeminoleSenegaleseSerbianShoshoneSierra LeoneanSiouxSlavicSlovakSloveneSomaliSouth AfricanSouth AmericanSouth American IndianSoviet UnionSpaniardSpanishSpanish AmericanSpanish American IndianSri LankanSubsaharan AfricanSudaneseSwedishSwissSyrianTaiwaneseThaiTlingit-HaidaTohono O'OdhamTonganTrinidadian and TobagonianTsimshianTurkishU.S. Virgin IslanderUgandanUkrainianUruguayanUteVenezuelanVietnameseWelshWest IndianYakamaYaquiYugoslavianYumanYup'ikZimbabwean
Immigration
NonimmigrantsImmigrantsAfghanistanAfricaAlbaniaArgentinaArmeniaAsiaAustriaBahamasBangladeshBarbadosBelarusBelgiumBelizeBoliviaBosnia and HerzegovinaBrazilBulgariaBurma/MyanmarCabo VerdeCambodiaCameroonCanadaCaribbeanCentral AmericaChileChinaColombiaCongoCosta RicaCroatiaCubaCzechoslovakiaDenmarkDominicaDominican RepublicEastern AfricaEastern AsiaEastern EuropeEcuadorEgyptEl SalvadorEnglandEritreaEthiopiaEuropeFijiFranceGermanyGhanaGreeceGrenadaGuatemalaGuyanaHaitiHondurasHong KongHungaryIndiaIndonesiaIranIraqIrelandIsraelItalyJamaicaJapanJordanKazakhstanKenyaKoreaKuwaitLaosLatin AmericaLatviaLebanonLiberiaLithuaniaMalaysiaMexicoMicronesiaMiddle AfricaMoldovaMoroccoNepalNetherlandsNicaraguaNigeriaNorth AmericaNorth MacedoniaNorthern AfricaNorthern EuropeNorwayOceaniaPakistanPanamaPeruPhilippinesPolandPortugalRomaniaRussiaSaudi ArabiaScotlandSenegalSerbiaSierra LeoneSingaporeSomaliaSouth AfricaSouth AmericaSouth Central AsiaSouth Eastern AsiaSouthern EuropeSpainSri LankaSt. Vincent and the GrenadinesSudanSwedenSwitzerlandSyriaTaiwanThailandTrinidad and TobagoTurkeyUgandaUkraineUruguayUzbekistanVenezuelaVietnamWest IndiesWestern AfricaWestern AsiaWestern EuropeYemenZaireZimbabweAzores
Immigrants from Australia
Race
Ancestry
AfghanAfricanAlaska NativeAlaskan AthabascanAlbanianAleutAlsatianAmericanApacheArabArapahoArgentineanArmenianAssyrian/Chaldean/SyriacAustralianAustrianBahamianBangladeshiBarbadianBasqueBelgianBelizeanBermudanBhutaneseBlackfeetBolivianBrazilianBritishBritish West IndianBulgarianBurmeseCajunCambodianCanadianCape VerdeanCarpatho RusynCelticCentral AmericanCentral American IndianCherokeeCheyenneChickasawChileanChineseChippewaChoctawColombianColvilleComancheCosta RicanCreeCreekCroatianCrowCubanCypriotCzechCzechoslovakianDanishDelawareDominicanDutchDutch West IndianEastern EuropeanEcuadorianEgyptianEnglishEstonianEthiopianEuropeanFijianFilipinoFinnishFrenchFrench American IndianFrench CanadianGermanGerman RussianGhanaianGreekGuamanian/ChamorroGuatemalanGuyaneseHaitianHmongHonduranHopiHoumaHungarianIcelanderIndian (Asian)IndonesianInupiatIranianIraqiIrishIroquoisIsraeliItalianJamaicanJapaneseKenyanKiowaKoreanLaotianLatvianLebaneseLiberianLithuanianLumbeeLuxembourgerMacedonianMalaysianMalteseMarshalleseMenomineeMexicanMexican American IndianMongolianMoroccanNative HawaiianNavajoNepaleseNew ZealanderNicaraguanNigerianNorthern EuropeanNorwegianOkinawanOsageOttawaPaiutePakistaniPalestinianPanamanianParaguayanPennsylvania GermanPeruvianPimaPolishPortuguesePotawatomiPuebloPuerto RicanPuget Sound SalishRomanianRussianSalvadoranSamoanScandinavianScotch-IrishScottishSeminoleSenegaleseSerbianShoshoneSierra LeoneanSiouxSlavicSlovakSloveneSomaliSouth AfricanSouth AmericanSouth American IndianSoviet UnionSpaniardSpanishSpanish AmericanSpanish American IndianSri LankanSubsaharan AfricanSudaneseSwedishSwissSyrianTaiwaneseThaiTlingit-HaidaTohono O'OdhamTonganTrinidadian and TobagonianTsimshianTurkishU.S. Virgin IslanderUgandanUkrainianUruguayanUteVenezuelanVietnameseWelshWest IndianYakamaYaquiYugoslavianYumanYup'ikZimbabwean
Immigration
NonimmigrantsImmigrantsAfghanistanAfricaAlbaniaArgentinaArmeniaAsiaAustraliaAustriaBahamasBangladeshBarbadosBelarusBelgiumBelizeBoliviaBosnia and HerzegovinaBrazilBulgariaBurma/MyanmarCabo VerdeCambodiaCameroonCanadaCaribbeanCentral AmericaChileChinaColombiaCongoCosta RicaCroatiaCubaCzechoslovakiaDenmarkDominicaDominican RepublicEastern AfricaEastern AsiaEastern EuropeEcuadorEgyptEl SalvadorEnglandEritreaEthiopiaEuropeFijiFranceGermanyGhanaGreeceGrenadaGuatemalaGuyanaHaitiHondurasHong KongHungaryIndiaIndonesiaIranIraqIrelandIsraelItalyJamaicaJapanJordanKazakhstanKenyaKoreaKuwaitLaosLatin AmericaLatviaLebanonLiberiaLithuaniaMalaysiaMexicoMicronesiaMiddle AfricaMoldovaMoroccoNepalNetherlandsNicaraguaNigeriaNorth AmericaNorth MacedoniaNorthern AfricaNorthern EuropeNorwayOceaniaPakistanPanamaPeruPhilippinesPolandPortugalRomaniaRussiaSaudi ArabiaScotlandSenegalSerbiaSierra LeoneSingaporeSomaliaSouth AfricaSouth AmericaSouth Central AsiaSouth Eastern AsiaSouthern EuropeSpainSri LankaSt. Vincent and the GrenadinesSudanSwedenSwitzerlandSyriaTaiwanThailandTrinidad and TobagoTurkeyUgandaUkraineUruguayUzbekistanVenezuelaVietnamWest IndiesWestern AfricaWestern AsiaWestern EuropeYemenZaireZimbabweAzores
8th Grade
Income
Poverty
Unemployment
Labor Participation
Family Structure
Vehicle Availability
Education Level
Disability

8th Grade Comparison

Jordanians

Immigrants from Australia

Exceptional
Exceptional
96.1%
8TH GRADE
91.3/ 100
METRIC RATING
136th/ 347
METRIC RANK
96.5%
8TH GRADE
99.0/ 100
METRIC RATING
87th/ 347
METRIC RANK

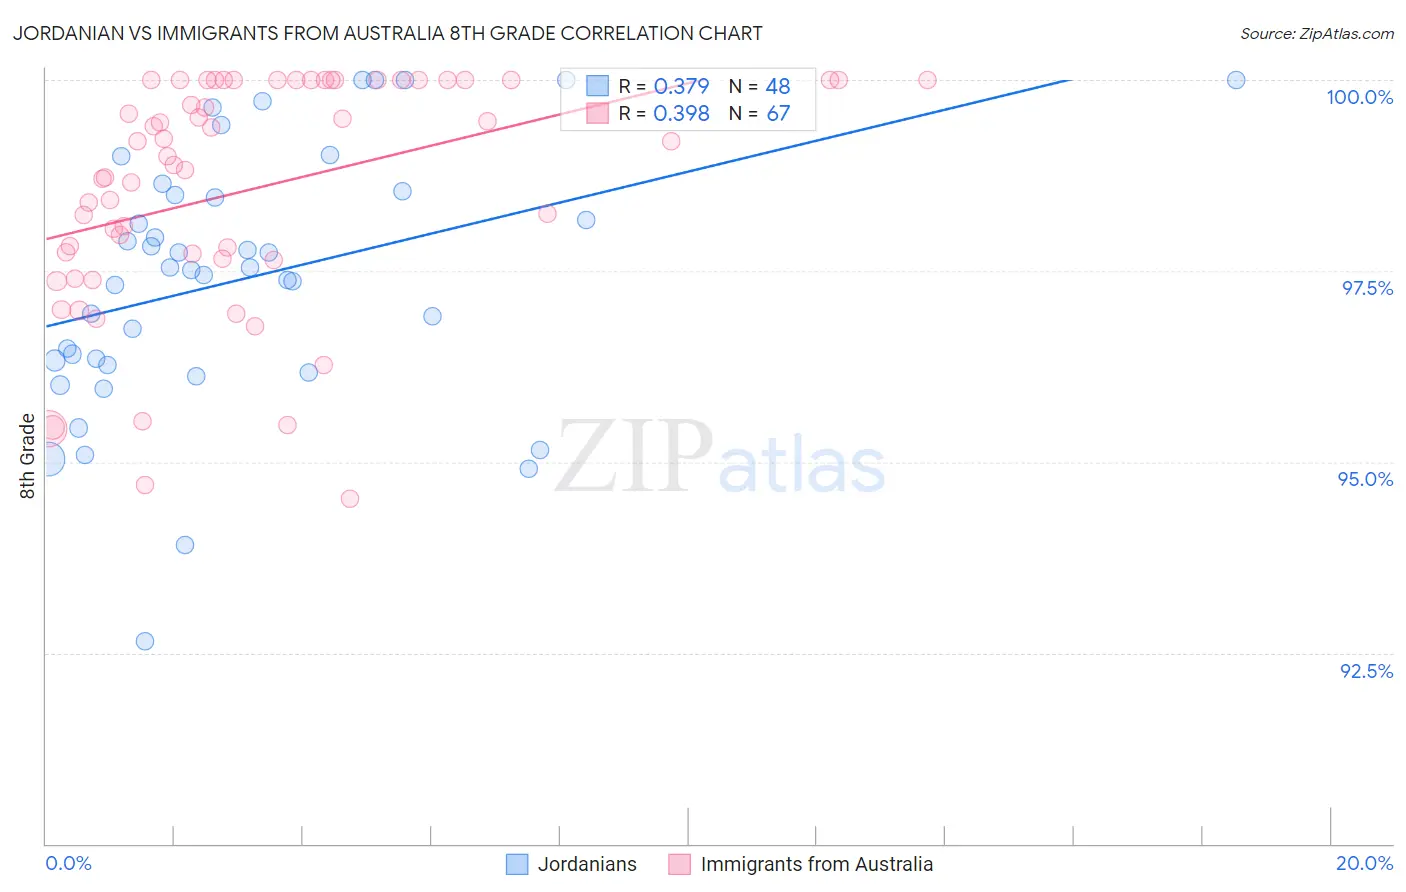
Jordanian vs Immigrants from Australia 8th Grade Correlation Chart

The statistical analysis conducted on geographies consisting of 166,403,553 people shows a mild positive correlation between the proportion of Jordanians and percentage of population with at least 8th grade education in the United States with a correlation coefficient (R) of 0.379 and weighted average of 96.1%. Similarly, the statistical analysis conducted on geographies consisting of 227,203,192 people shows a mild positive correlation between the proportion of Immigrants from Australia and percentage of population with at least 8th grade education in the United States with a correlation coefficient (R) of 0.398 and weighted average of 96.5%, a difference of 0.37%.
Jordanian vs Immigrants from Australia 8th Grade

8th Grade Correlation Summary

MeasurementJordanianImmigrants from Australia
Minimum92.6%94.5%
Maximum100.0%100.0%
Range7.4%5.5%
Mean97.4%98.6%
Median97.5%99.0%
Interquartile 25% (IQ1)96.3%97.7%
Interquartile 75% (IQ3)98.5%100.0%
Interquartile Range (IQR)2.2%2.3%
Standard Deviation (Sample)1.7%1.5%
Standard Deviation (Population)1.7%1.5%

Similar Demographics by 8th Grade

Demographics Similar to Jordanians by 8th Grade

In terms of 8th grade, the demographic groups most similar to Jordanians are Immigrants from Hungary (96.1%, a difference of 0.0%), Basque (96.1%, a difference of 0.0%), Immigrants from Turkey (96.1%, a difference of 0.010%), Cambodian (96.1%, a difference of 0.010%), and Pueblo (96.1%, a difference of 0.020%).
DemographicsRating | Rank8th Grade
Cheyenne
93.3
/100
|
#129
Exceptional
96.1%
Soviet Union
92.6
/100
|
#130
Exceptional
96.1%
Pueblo
92.3
/100
|
#131
Exceptional
96.1%
Immigrants | Kuwait
92.2
/100
|
#132
Exceptional
96.1%
Immigrants | Turkey
91.7
/100
|
#133
Exceptional
96.1%
Immigrants | Hungary
91.5
/100
|
#134
Exceptional
96.1%
Basques
91.5
/100
|
#135
Exceptional
96.1%
Jordanians
91.3
/100
|
#136
Exceptional
96.1%
Cambodians
90.6
/100
|
#137
Exceptional
96.1%
Burmese
90.2
/100
|
#138
Exceptional
96.1%
Hmong
89.7
/100
|
#139
Excellent
96.1%
Immigrants | South Central Asia
89.4
/100
|
#140
Excellent
96.1%
Immigrants | Greece
85.9
/100
|
#141
Excellent
96.0%
Immigrants | Eastern Europe
85.4
/100
|
#142
Excellent
96.0%
Spanish
85.1
/100
|
#143
Excellent
96.0%

Demographics Similar to Immigrants from Australia by 8th Grade

In terms of 8th grade, the demographic groups most similar to Immigrants from Australia are Immigrants from South Africa (96.5%, a difference of 0.0%), Cherokee (96.5%, a difference of 0.0%), Immigrants from Western Europe (96.4%, a difference of 0.010%), Immigrants from Belgium (96.5%, a difference of 0.020%), and Chickasaw (96.4%, a difference of 0.020%).
DemographicsRating | Rank8th Grade
Delaware
99.2
/100
|
#80
Exceptional
96.5%
Romanians
99.2
/100
|
#81
Exceptional
96.5%
Turks
99.2
/100
|
#82
Exceptional
96.5%
Icelanders
99.2
/100
|
#83
Exceptional
96.5%
Immigrants | Belgium
99.1
/100
|
#84
Exceptional
96.5%
Immigrants | South Africa
99.1
/100
|
#85
Exceptional
96.5%
Cherokee
99.0
/100
|
#86
Exceptional
96.5%
Immigrants | Australia
99.0
/100
|
#87
Exceptional
96.5%
Immigrants | Western Europe
99.0
/100
|
#88
Exceptional
96.4%
Chickasaw
98.9
/100
|
#89
Exceptional
96.4%
Immigrants | Sweden
98.9
/100
|
#90
Exceptional
96.4%
Thais
98.9
/100
|
#91
Exceptional
96.4%
Menominee
98.9
/100
|
#92
Exceptional
96.4%
Immigrants | Denmark
98.8
/100
|
#93
Exceptional
96.4%
Immigrants | Singapore
98.8
/100
|
#94
Exceptional
96.4%