Jordanian vs Australian High School Diploma

COMPARE

Jordanian
Race
Ancestry
AfghanAfricanAlaska NativeAlaskan AthabascanAlbanianAleutAlsatianAmericanApacheArabArapahoArgentineanArmenianAssyrian/Chaldean/SyriacAustrianBahamianBangladeshiBarbadianBasqueBelgianBelizeanBermudanBhutaneseBlackfeetBolivianBrazilianBritishBritish West IndianBulgarianBurmeseCajunCambodianCanadianCape VerdeanCarpatho RusynCelticCentral AmericanCentral American IndianCherokeeCheyenneChickasawChileanChineseChippewaChoctawColombianColvilleComancheCosta RicanCreeCreekCroatianCrowCubanCypriotCzechCzechoslovakianDanishDelawareDominicanDutchDutch West IndianEastern EuropeanEcuadorianEgyptianEnglishEstonianEthiopianEuropeanFijianFilipinoFinnishFrenchFrench American IndianFrench CanadianGermanGerman RussianGhanaianGreekGuamanian/ChamorroGuatemalanGuyaneseHaitianHmongHonduranHopiHoumaHungarianIcelanderIndian (Asian)IndonesianInupiatIranianIraqiIrishIroquoisIsraeliItalianJamaicanJapaneseJordanianKenyanKiowaKoreanLaotianLatvianLebaneseLiberianLithuanianLumbeeLuxembourgerMacedonianMalaysianMalteseMarshalleseMenomineeMexicanMexican American IndianMongolianMoroccanNative HawaiianNavajoNepaleseNew ZealanderNicaraguanNigerianNorthern EuropeanNorwegianOkinawanOsageOttawaPaiutePakistaniPalestinianPanamanianParaguayanPennsylvania GermanPeruvianPimaPolishPortuguesePotawatomiPuebloPuerto RicanPuget Sound SalishRomanianRussianSalvadoranSamoanScandinavianScotch-IrishScottishSeminoleSenegaleseSerbianShoshoneSierra LeoneanSiouxSlavicSlovakSloveneSomaliSouth AfricanSouth AmericanSouth American IndianSoviet UnionSpaniardSpanishSpanish AmericanSpanish American IndianSri LankanSubsaharan AfricanSudaneseSwedishSwissSyrianTaiwaneseThaiTlingit-HaidaTohono O'OdhamTonganTrinidadian and TobagonianTsimshianTurkishU.S. Virgin IslanderUgandanUkrainianUruguayanUteVenezuelanVietnameseWelshWest IndianYakamaYaquiYugoslavianYumanYup'ikZimbabwean
Immigration
NonimmigrantsImmigrantsAfghanistanAfricaAlbaniaArgentinaArmeniaAsiaAustraliaAustriaBahamasBangladeshBarbadosBelarusBelgiumBelizeBoliviaBosnia and HerzegovinaBrazilBulgariaBurma/MyanmarCabo VerdeCambodiaCameroonCanadaCaribbeanCentral AmericaChileChinaColombiaCongoCosta RicaCroatiaCubaCzechoslovakiaDenmarkDominicaDominican RepublicEastern AfricaEastern AsiaEastern EuropeEcuadorEgyptEl SalvadorEnglandEritreaEthiopiaEuropeFijiFranceGermanyGhanaGreeceGrenadaGuatemalaGuyanaHaitiHondurasHong KongHungaryIndiaIndonesiaIranIraqIrelandIsraelItalyJamaicaJapanJordanKazakhstanKenyaKoreaKuwaitLaosLatin AmericaLatviaLebanonLiberiaLithuaniaMalaysiaMexicoMicronesiaMiddle AfricaMoldovaMoroccoNepalNetherlandsNicaraguaNigeriaNorth AmericaNorth MacedoniaNorthern AfricaNorthern EuropeNorwayOceaniaPakistanPanamaPeruPhilippinesPolandPortugalRomaniaRussiaSaudi ArabiaScotlandSenegalSerbiaSierra LeoneSingaporeSomaliaSouth AfricaSouth AmericaSouth Central AsiaSouth Eastern AsiaSouthern EuropeSpainSri LankaSt. Vincent and the GrenadinesSudanSwedenSwitzerlandSyriaTaiwanThailandTrinidad and TobagoTurkeyUgandaUkraineUruguayUzbekistanVenezuelaVietnamWest IndiesWestern AfricaWestern AsiaWestern EuropeYemenZaireZimbabweAzores
Australian
Race
Ancestry
AfghanAfricanAlaska NativeAlaskan AthabascanAlbanianAleutAlsatianAmericanApacheArabArapahoArgentineanArmenianAssyrian/Chaldean/SyriacAustralianAustrianBahamianBangladeshiBarbadianBasqueBelgianBelizeanBermudanBhutaneseBlackfeetBolivianBrazilianBritishBritish West IndianBulgarianBurmeseCajunCambodianCanadianCape VerdeanCarpatho RusynCelticCentral AmericanCentral American IndianCherokeeCheyenneChickasawChileanChineseChippewaChoctawColombianColvilleComancheCosta RicanCreeCreekCroatianCrowCubanCypriotCzechCzechoslovakianDanishDelawareDominicanDutchDutch West IndianEastern EuropeanEcuadorianEgyptianEnglishEstonianEthiopianEuropeanFijianFilipinoFinnishFrenchFrench American IndianFrench CanadianGermanGerman RussianGhanaianGreekGuamanian/ChamorroGuatemalanGuyaneseHaitianHmongHonduranHopiHoumaHungarianIcelanderIndian (Asian)IndonesianInupiatIranianIraqiIrishIroquoisIsraeliItalianJamaicanJapaneseKenyanKiowaKoreanLaotianLatvianLebaneseLiberianLithuanianLumbeeLuxembourgerMacedonianMalaysianMalteseMarshalleseMenomineeMexicanMexican American IndianMongolianMoroccanNative HawaiianNavajoNepaleseNew ZealanderNicaraguanNigerianNorthern EuropeanNorwegianOkinawanOsageOttawaPaiutePakistaniPalestinianPanamanianParaguayanPennsylvania GermanPeruvianPimaPolishPortuguesePotawatomiPuebloPuerto RicanPuget Sound SalishRomanianRussianSalvadoranSamoanScandinavianScotch-IrishScottishSeminoleSenegaleseSerbianShoshoneSierra LeoneanSiouxSlavicSlovakSloveneSomaliSouth AfricanSouth AmericanSouth American IndianSoviet UnionSpaniardSpanishSpanish AmericanSpanish American IndianSri LankanSubsaharan AfricanSudaneseSwedishSwissSyrianTaiwaneseThaiTlingit-HaidaTohono O'OdhamTonganTrinidadian and TobagonianTsimshianTurkishU.S. Virgin IslanderUgandanUkrainianUruguayanUteVenezuelanVietnameseWelshWest IndianYakamaYaquiYugoslavianYumanYup'ikZimbabwean
Immigration
NonimmigrantsImmigrantsAfghanistanAfricaAlbaniaArgentinaArmeniaAsiaAustraliaAustriaBahamasBangladeshBarbadosBelarusBelgiumBelizeBoliviaBosnia and HerzegovinaBrazilBulgariaBurma/MyanmarCabo VerdeCambodiaCameroonCanadaCaribbeanCentral AmericaChileChinaColombiaCongoCosta RicaCroatiaCubaCzechoslovakiaDenmarkDominicaDominican RepublicEastern AfricaEastern AsiaEastern EuropeEcuadorEgyptEl SalvadorEnglandEritreaEthiopiaEuropeFijiFranceGermanyGhanaGreeceGrenadaGuatemalaGuyanaHaitiHondurasHong KongHungaryIndiaIndonesiaIranIraqIrelandIsraelItalyJamaicaJapanJordanKazakhstanKenyaKoreaKuwaitLaosLatin AmericaLatviaLebanonLiberiaLithuaniaMalaysiaMexicoMicronesiaMiddle AfricaMoldovaMoroccoNepalNetherlandsNicaraguaNigeriaNorth AmericaNorth MacedoniaNorthern AfricaNorthern EuropeNorwayOceaniaPakistanPanamaPeruPhilippinesPolandPortugalRomaniaRussiaSaudi ArabiaScotlandSenegalSerbiaSierra LeoneSingaporeSomaliaSouth AfricaSouth AmericaSouth Central AsiaSouth Eastern AsiaSouthern EuropeSpainSri LankaSt. Vincent and the GrenadinesSudanSwedenSwitzerlandSyriaTaiwanThailandTrinidad and TobagoTurkeyUgandaUkraineUruguayUzbekistanVenezuelaVietnamWest IndiesWestern AfricaWestern AsiaWestern EuropeYemenZaireZimbabweAzores
High School Diploma
Income
Poverty
Unemployment
Labor Participation
Family Structure
Vehicle Availability
Education Level
Disability

High School Diploma Comparison

Jordanians

Australians

Exceptional
Exceptional
90.2%
HIGH SCHOOL DIPLOMA
95.4/ 100
METRIC RATING
117th/ 347
METRIC RANK
91.2%
HIGH SCHOOL DIPLOMA
99.8/ 100
METRIC RATING
47th/ 347
METRIC RANK

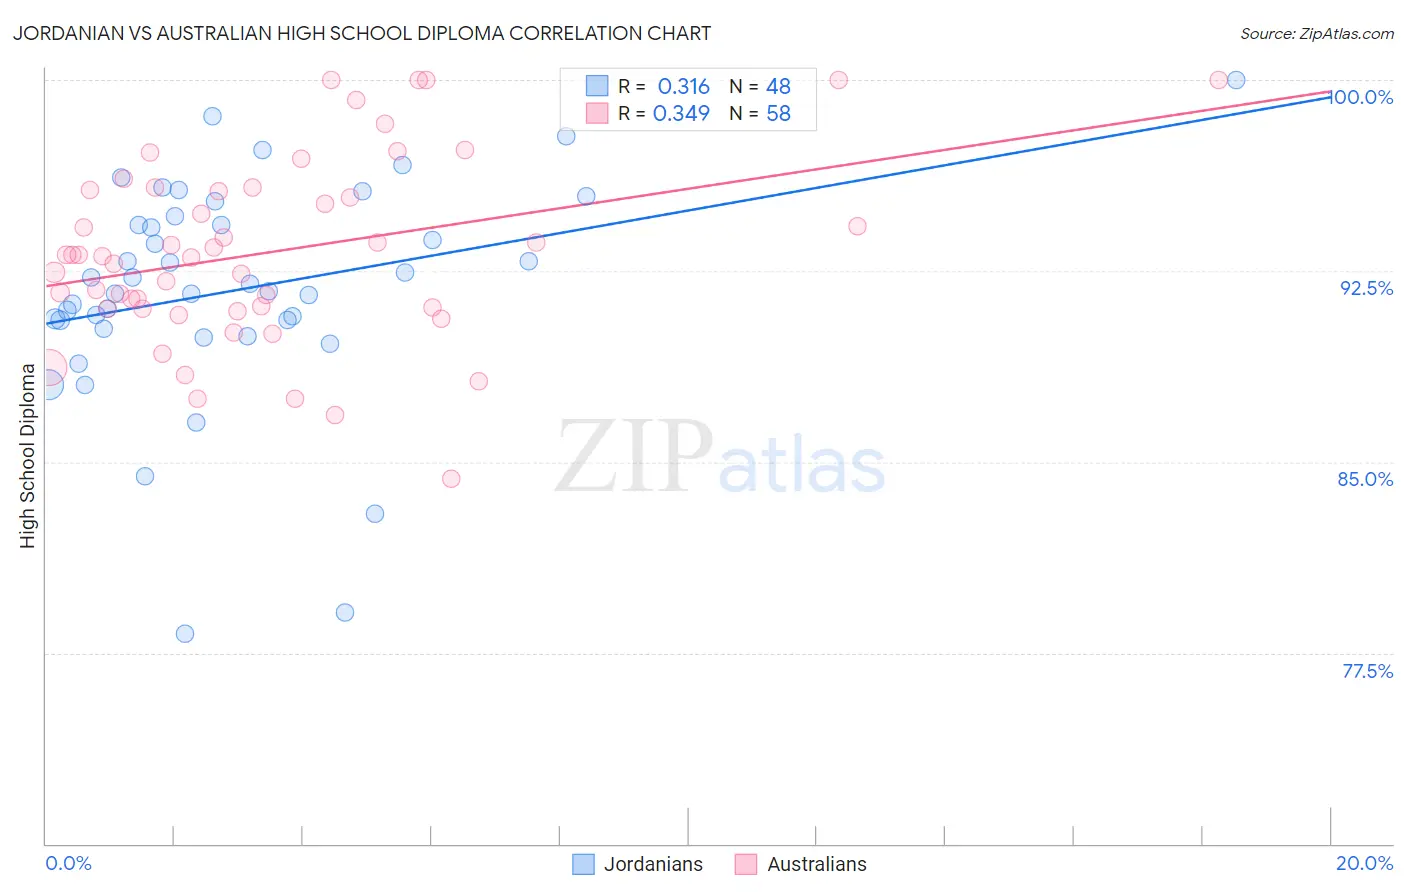
Jordanian vs Australian High School Diploma Correlation Chart

The statistical analysis conducted on geographies consisting of 166,423,935 people shows a mild positive correlation between the proportion of Jordanians and percentage of population with at least high school diploma education in the United States with a correlation coefficient (R) of 0.316 and weighted average of 90.2%. Similarly, the statistical analysis conducted on geographies consisting of 224,152,919 people shows a mild positive correlation between the proportion of Australians and percentage of population with at least high school diploma education in the United States with a correlation coefficient (R) of 0.349 and weighted average of 91.2%, a difference of 1.2%.
Jordanian vs Australian High School Diploma

High School Diploma Correlation Summary

MeasurementJordanianAustralian
Minimum78.2%84.3%
Maximum100.0%100.0%
Range21.8%15.7%
Mean91.8%93.3%
Median91.9%93.1%
Interquartile 25% (IQ1)90.4%91.0%
Interquartile 75% (IQ3)94.5%95.7%
Interquartile Range (IQR)4.1%4.7%
Standard Deviation (Sample)4.4%3.6%
Standard Deviation (Population)4.3%3.6%

Similar Demographics by High School Diploma

Demographics Similar to Jordanians by High School Diploma

In terms of high school diploma, the demographic groups most similar to Jordanians are Israeli (90.1%, a difference of 0.020%), Immigrants from Germany (90.2%, a difference of 0.030%), Immigrants from Hungary (90.2%, a difference of 0.040%), Immigrants from Eastern Europe (90.1%, a difference of 0.040%), and Ottawa (90.1%, a difference of 0.070%).
DemographicsRating | RankHigh School Diploma
Immigrants | Greece
96.6
/100
|
#110
Exceptional
90.3%
Menominee
96.6
/100
|
#111
Exceptional
90.3%
Immigrants | Belarus
96.4
/100
|
#112
Exceptional
90.2%
Immigrants | Sri Lanka
96.3
/100
|
#113
Exceptional
90.2%
Yugoslavians
96.2
/100
|
#114
Exceptional
90.2%
Immigrants | Hungary
95.8
/100
|
#115
Exceptional
90.2%
Immigrants | Germany
95.7
/100
|
#116
Exceptional
90.2%
Jordanians
95.4
/100
|
#117
Exceptional
90.2%
Israelis
95.1
/100
|
#118
Exceptional
90.1%
Immigrants | Eastern Europe
94.9
/100
|
#119
Exceptional
90.1%
Ottawa
94.4
/100
|
#120
Exceptional
90.1%
Whites/Caucasians
94.1
/100
|
#121
Exceptional
90.1%
Immigrants | Kazakhstan
93.4
/100
|
#122
Exceptional
90.0%
German Russians
92.0
/100
|
#123
Exceptional
90.0%
Mongolians
91.6
/100
|
#124
Exceptional
89.9%

Demographics Similar to Australians by High School Diploma

In terms of high school diploma, the demographic groups most similar to Australians are Belgian (91.2%, a difference of 0.0%), Greek (91.2%, a difference of 0.010%), Bhutanese (91.2%, a difference of 0.010%), Welsh (91.2%, a difference of 0.030%), and Immigrants from Austria (91.3%, a difference of 0.050%).
DemographicsRating | RankHigh School Diploma
Immigrants | Lithuania
99.8
/100
|
#40
Exceptional
91.3%
Immigrants | Australia
99.8
/100
|
#41
Exceptional
91.3%
Northern Europeans
99.8
/100
|
#42
Exceptional
91.3%
British
99.8
/100
|
#43
Exceptional
91.3%
Immigrants | Austria
99.8
/100
|
#44
Exceptional
91.3%
Turks
99.8
/100
|
#45
Exceptional
91.2%
Greeks
99.8
/100
|
#46
Exceptional
91.2%
Australians
99.8
/100
|
#47
Exceptional
91.2%
Belgians
99.8
/100
|
#48
Exceptional
91.2%
Bhutanese
99.8
/100
|
#49
Exceptional
91.2%
Welsh
99.8
/100
|
#50
Exceptional
91.2%
New Zealanders
99.7
/100
|
#51
Exceptional
91.1%
Immigrants | Sweden
99.7
/100
|
#52
Exceptional
91.1%
Immigrants | Belgium
99.7
/100
|
#53
Exceptional
91.1%
Macedonians
99.7
/100
|
#54
Exceptional
91.1%