Japanese vs Immigrants from Somalia 7th Grade

COMPARE

Japanese
Race
Ancestry
AfghanAfricanAlaska NativeAlaskan AthabascanAlbanianAleutAlsatianAmericanApacheArabArapahoArgentineanArmenianAssyrian/Chaldean/SyriacAustralianAustrianBahamianBangladeshiBarbadianBasqueBelgianBelizeanBermudanBhutaneseBlackfeetBolivianBrazilianBritishBritish West IndianBulgarianBurmeseCajunCambodianCanadianCape VerdeanCarpatho RusynCelticCentral AmericanCentral American IndianCherokeeCheyenneChickasawChileanChineseChippewaChoctawColombianColvilleComancheCosta RicanCreeCreekCroatianCrowCubanCypriotCzechCzechoslovakianDanishDelawareDominicanDutchDutch West IndianEastern EuropeanEcuadorianEgyptianEnglishEstonianEthiopianEuropeanFijianFilipinoFinnishFrenchFrench American IndianFrench CanadianGermanGerman RussianGhanaianGreekGuamanian/ChamorroGuatemalanGuyaneseHaitianHmongHonduranHopiHoumaHungarianIcelanderIndian (Asian)IndonesianInupiatIranianIraqiIrishIroquoisIsraeliItalianJamaicanJapaneseJordanianKenyanKiowaKoreanLaotianLatvianLebaneseLiberianLithuanianLumbeeLuxembourgerMacedonianMalaysianMalteseMarshalleseMenomineeMexicanMexican American IndianMongolianMoroccanNative HawaiianNavajoNepaleseNew ZealanderNicaraguanNigerianNorthern EuropeanNorwegianOkinawanOsageOttawaPaiutePakistaniPalestinianPanamanianParaguayanPennsylvania GermanPeruvianPimaPolishPortuguesePotawatomiPuebloPuerto RicanPuget Sound SalishRomanianRussianSalvadoranSamoanScandinavianScotch-IrishScottishSeminoleSenegaleseSerbianShoshoneSierra LeoneanSiouxSlavicSlovakSloveneSomaliSouth AfricanSouth AmericanSouth American IndianSoviet UnionSpaniardSpanishSpanish AmericanSpanish American IndianSri LankanSubsaharan AfricanSudaneseSwedishSwissSyrianTaiwaneseThaiTlingit-HaidaTohono O'OdhamTonganTrinidadian and TobagonianTsimshianTurkishU.S. Virgin IslanderUgandanUkrainianUruguayanUteVenezuelanVietnameseWelshWest IndianYakamaYaquiYugoslavianYumanYup'ikZimbabwean
Immigration
NonimmigrantsImmigrantsAfghanistanAfricaAlbaniaArgentinaArmeniaAsiaAustraliaAustriaBahamasBangladeshBarbadosBelarusBelgiumBelizeBoliviaBosnia and HerzegovinaBrazilBulgariaBurma/MyanmarCabo VerdeCambodiaCameroonCanadaCaribbeanCentral AmericaChileChinaColombiaCongoCosta RicaCroatiaCubaCzechoslovakiaDenmarkDominicaDominican RepublicEastern AfricaEastern AsiaEastern EuropeEcuadorEgyptEl SalvadorEnglandEritreaEthiopiaEuropeFijiFranceGermanyGhanaGreeceGrenadaGuatemalaGuyanaHaitiHondurasHong KongHungaryIndiaIndonesiaIranIraqIrelandIsraelItalyJamaicaJapanJordanKazakhstanKenyaKoreaKuwaitLaosLatin AmericaLatviaLebanonLiberiaLithuaniaMalaysiaMexicoMicronesiaMiddle AfricaMoldovaMoroccoNepalNetherlandsNicaraguaNigeriaNorth AmericaNorth MacedoniaNorthern AfricaNorthern EuropeNorwayOceaniaPakistanPanamaPeruPhilippinesPolandPortugalRomaniaRussiaSaudi ArabiaScotlandSenegalSerbiaSierra LeoneSingaporeSouth AfricaSouth AmericaSouth Central AsiaSouth Eastern AsiaSouthern EuropeSpainSri LankaSt. Vincent and the GrenadinesSudanSwedenSwitzerlandSyriaTaiwanThailandTrinidad and TobagoTurkeyUgandaUkraineUruguayUzbekistanVenezuelaVietnamWest IndiesWestern AfricaWestern AsiaWestern EuropeYemenZaireZimbabweAzores
Immigrants from Somalia
Race
Ancestry
AfghanAfricanAlaska NativeAlaskan AthabascanAlbanianAleutAlsatianAmericanApacheArabArapahoArgentineanArmenianAssyrian/Chaldean/SyriacAustralianAustrianBahamianBangladeshiBarbadianBasqueBelgianBelizeanBermudanBhutaneseBlackfeetBolivianBrazilianBritishBritish West IndianBulgarianBurmeseCajunCambodianCanadianCape VerdeanCarpatho RusynCelticCentral AmericanCentral American IndianCherokeeCheyenneChickasawChileanChineseChippewaChoctawColombianColvilleComancheCosta RicanCreeCreekCroatianCrowCubanCypriotCzechCzechoslovakianDanishDelawareDominicanDutchDutch West IndianEastern EuropeanEcuadorianEgyptianEnglishEstonianEthiopianEuropeanFijianFilipinoFinnishFrenchFrench American IndianFrench CanadianGermanGerman RussianGhanaianGreekGuamanian/ChamorroGuatemalanGuyaneseHaitianHmongHonduranHopiHoumaHungarianIcelanderIndian (Asian)IndonesianInupiatIranianIraqiIrishIroquoisIsraeliItalianJamaicanJordanianKenyanKiowaKoreanLaotianLatvianLebaneseLiberianLithuanianLumbeeLuxembourgerMacedonianMalaysianMalteseMarshalleseMenomineeMexicanMexican American IndianMongolianMoroccanNative HawaiianNavajoNepaleseNew ZealanderNicaraguanNigerianNorthern EuropeanNorwegianOkinawanOsageOttawaPaiutePakistaniPalestinianPanamanianParaguayanPennsylvania GermanPeruvianPimaPolishPortuguesePotawatomiPuebloPuerto RicanPuget Sound SalishRomanianRussianSalvadoranSamoanScandinavianScotch-IrishScottishSeminoleSenegaleseSerbianShoshoneSierra LeoneanSiouxSlavicSlovakSloveneSomaliSouth AfricanSouth AmericanSouth American IndianSoviet UnionSpaniardSpanishSpanish AmericanSpanish American IndianSri LankanSubsaharan AfricanSudaneseSwedishSwissSyrianTaiwaneseThaiTlingit-HaidaTohono O'OdhamTonganTrinidadian and TobagonianTsimshianTurkishU.S. Virgin IslanderUgandanUkrainianUruguayanUteVenezuelanVietnameseWelshWest IndianYakamaYaquiYugoslavianYumanYup'ikZimbabwean
Immigration
NonimmigrantsImmigrantsAfghanistanAfricaAlbaniaArgentinaArmeniaAsiaAustraliaAustriaBahamasBangladeshBarbadosBelarusBelgiumBelizeBoliviaBosnia and HerzegovinaBrazilBulgariaBurma/MyanmarCabo VerdeCambodiaCameroonCanadaCaribbeanCentral AmericaChileChinaColombiaCongoCosta RicaCroatiaCubaCzechoslovakiaDenmarkDominicaDominican RepublicEastern AfricaEastern AsiaEastern EuropeEcuadorEgyptEl SalvadorEnglandEritreaEthiopiaEuropeFijiFranceGermanyGhanaGreeceGrenadaGuatemalaGuyanaHaitiHondurasHong KongHungaryIndiaIndonesiaIranIraqIrelandIsraelItalyJamaicaJapanJordanKazakhstanKenyaKoreaKuwaitLaosLatin AmericaLatviaLebanonLiberiaLithuaniaMalaysiaMexicoMicronesiaMiddle AfricaMoldovaMoroccoNepalNetherlandsNicaraguaNigeriaNorth AmericaNorth MacedoniaNorthern AfricaNorthern EuropeNorwayOceaniaPakistanPanamaPeruPhilippinesPolandPortugalRomaniaRussiaSaudi ArabiaScotlandSenegalSerbiaSierra LeoneSingaporeSomaliaSouth AfricaSouth AmericaSouth Central AsiaSouth Eastern AsiaSouthern EuropeSpainSri LankaSt. Vincent and the GrenadinesSudanSwedenSwitzerlandSyriaTaiwanThailandTrinidad and TobagoTurkeyUgandaUkraineUruguayUzbekistanVenezuelaVietnamWest IndiesWestern AfricaWestern AsiaWestern EuropeYemenZaireZimbabweAzores
7th Grade
Income
Poverty
Unemployment
Labor Participation
Family Structure
Vehicle Availability
Education Level
Disability

7th Grade Comparison

Japanese

Immigrants from Somalia

Tragic
Tragic
94.0%
7TH GRADE
0.0/ 100
METRIC RATING
314th/ 347
METRIC RANK
95.2%
7TH GRADE
0.5/ 100
METRIC RATING
262nd/ 347
METRIC RANK

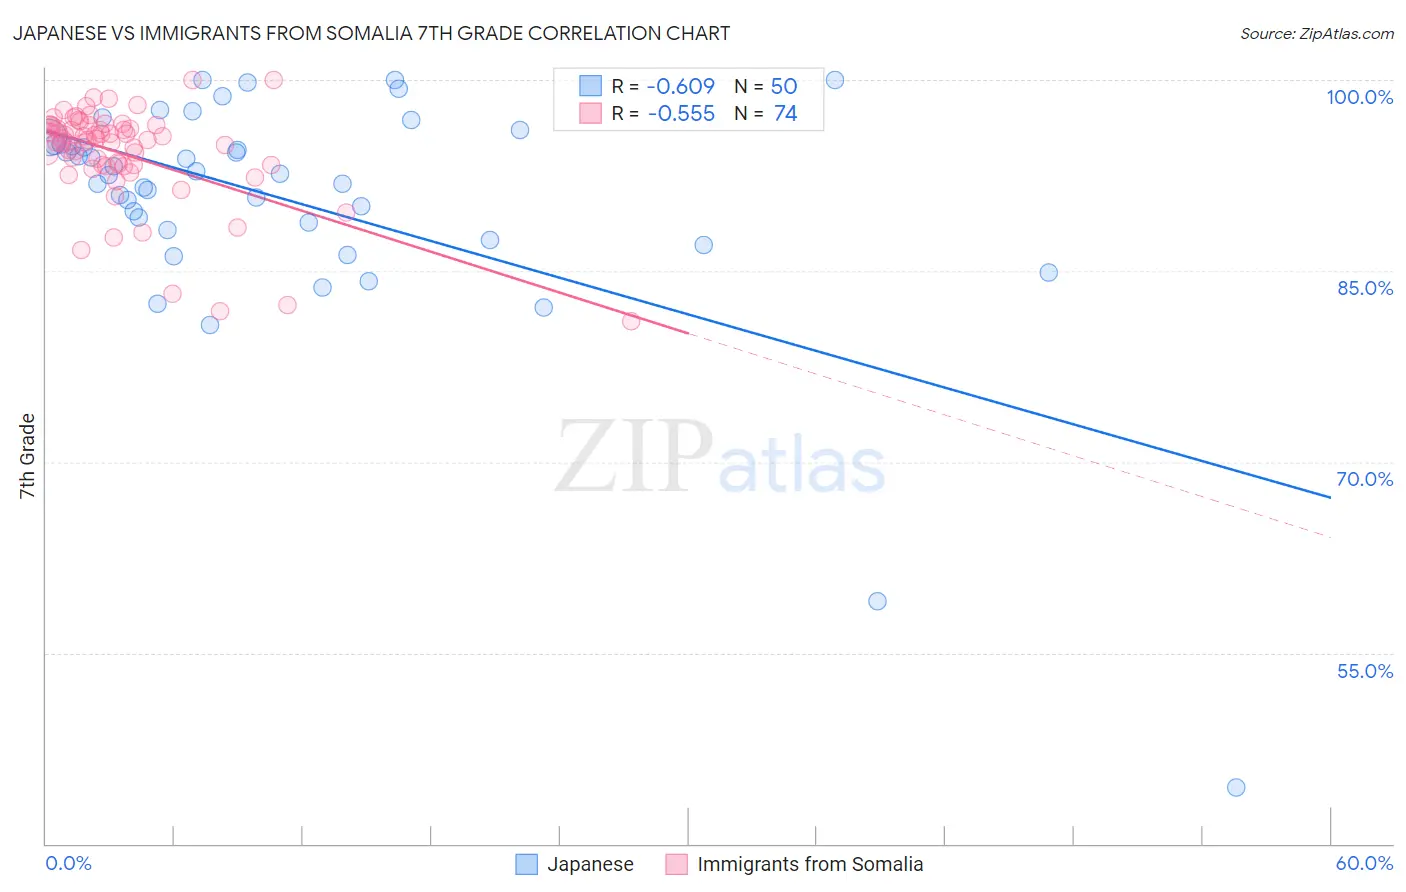
Japanese vs Immigrants from Somalia 7th Grade Correlation Chart

The statistical analysis conducted on geographies consisting of 249,183,224 people shows a significant negative correlation between the proportion of Japanese and percentage of population with at least 7th grade education in the United States with a correlation coefficient (R) of -0.609 and weighted average of 94.0%. Similarly, the statistical analysis conducted on geographies consisting of 92,098,504 people shows a substantial negative correlation between the proportion of Immigrants from Somalia and percentage of population with at least 7th grade education in the United States with a correlation coefficient (R) of -0.555 and weighted average of 95.2%, a difference of 1.4%.
Japanese vs Immigrants from Somalia 7th Grade

7th Grade Correlation Summary

MeasurementJapaneseImmigrants from Somalia
Minimum44.4%81.1%
Maximum100.0%100.0%
Range55.6%18.9%
Mean90.5%94.2%
Median92.6%95.3%
Interquartile 25% (IQ1)88.2%93.3%
Interquartile 75% (IQ3)95.0%96.4%
Interquartile Range (IQR)6.8%3.2%
Standard Deviation (Sample)9.5%3.9%
Standard Deviation (Population)9.4%3.9%

Similar Demographics by 7th Grade

Demographics Similar to Japanese by 7th Grade

In terms of 7th grade, the demographic groups most similar to Japanese are Immigrants (94.0%, a difference of 0.030%), Immigrants from Bangladesh (94.0%, a difference of 0.030%), Vietnamese (93.9%, a difference of 0.050%), Puerto Rican (94.0%, a difference of 0.070%), and Immigrants from Caribbean (94.0%, a difference of 0.080%).
DemographicsRating | Rank7th Grade
Immigrants | Portugal
0.0
/100
|
#307
Tragic
94.2%
Cape Verdeans
0.0
/100
|
#308
Tragic
94.1%
Ecuadorians
0.0
/100
|
#309
Tragic
94.0%
Immigrants | Caribbean
0.0
/100
|
#310
Tragic
94.0%
Puerto Ricans
0.0
/100
|
#311
Tragic
94.0%
Immigrants | Immigrants
0.0
/100
|
#312
Tragic
94.0%
Immigrants | Bangladesh
0.0
/100
|
#313
Tragic
94.0%
Japanese
0.0
/100
|
#314
Tragic
94.0%
Vietnamese
0.0
/100
|
#315
Tragic
93.9%
Immigrants | Vietnam
0.0
/100
|
#316
Tragic
93.9%
Immigrants | Cuba
0.0
/100
|
#317
Tragic
93.8%
Immigrants | Ecuador
0.0
/100
|
#318
Tragic
93.7%
Immigrants | Cambodia
0.0
/100
|
#319
Tragic
93.7%
Immigrants | Fiji
0.0
/100
|
#320
Tragic
93.5%
Belizeans
0.0
/100
|
#321
Tragic
93.5%

Demographics Similar to Immigrants from Somalia by 7th Grade

In terms of 7th grade, the demographic groups most similar to Immigrants from Somalia are South American (95.2%, a difference of 0.0%), West Indian (95.2%, a difference of 0.0%), Afghan (95.3%, a difference of 0.010%), Immigrants from Nigeria (95.2%, a difference of 0.010%), and Immigrants from Costa Rica (95.3%, a difference of 0.040%).
DemographicsRating | Rank7th Grade
Koreans
0.8
/100
|
#255
Tragic
95.3%
Immigrants | China
0.7
/100
|
#256
Tragic
95.3%
Immigrants | Congo
0.7
/100
|
#257
Tragic
95.3%
Ghanaians
0.7
/100
|
#258
Tragic
95.3%
Immigrants | Costa Rica
0.6
/100
|
#259
Tragic
95.3%
Afghans
0.5
/100
|
#260
Tragic
95.3%
South Americans
0.5
/100
|
#261
Tragic
95.2%
Immigrants | Somalia
0.5
/100
|
#262
Tragic
95.2%
West Indians
0.5
/100
|
#263
Tragic
95.2%
Immigrants | Nigeria
0.4
/100
|
#264
Tragic
95.2%
Immigrants | Uruguay
0.3
/100
|
#265
Tragic
95.2%
Immigrants | Ghana
0.3
/100
|
#266
Tragic
95.2%
Yuman
0.3
/100
|
#267
Tragic
95.2%
Immigrants | Hong Kong
0.3
/100
|
#268
Tragic
95.2%
Trinidadians and Tobagonians
0.3
/100
|
#269
Tragic
95.2%