Israeli vs Immigrants from Cameroon 3rd Grade
COMPARE
Israeli
Immigrants from Cameroon
3rd Grade
3rd Grade Comparison
Israelis
Immigrants from Cameroon
97.9%
3RD GRADE
86.6/ 100
METRIC RATING
138th/ 347
METRIC RANK
97.2%
3RD GRADE
0.1/ 100
METRIC RATING
274th/ 347
METRIC RANK
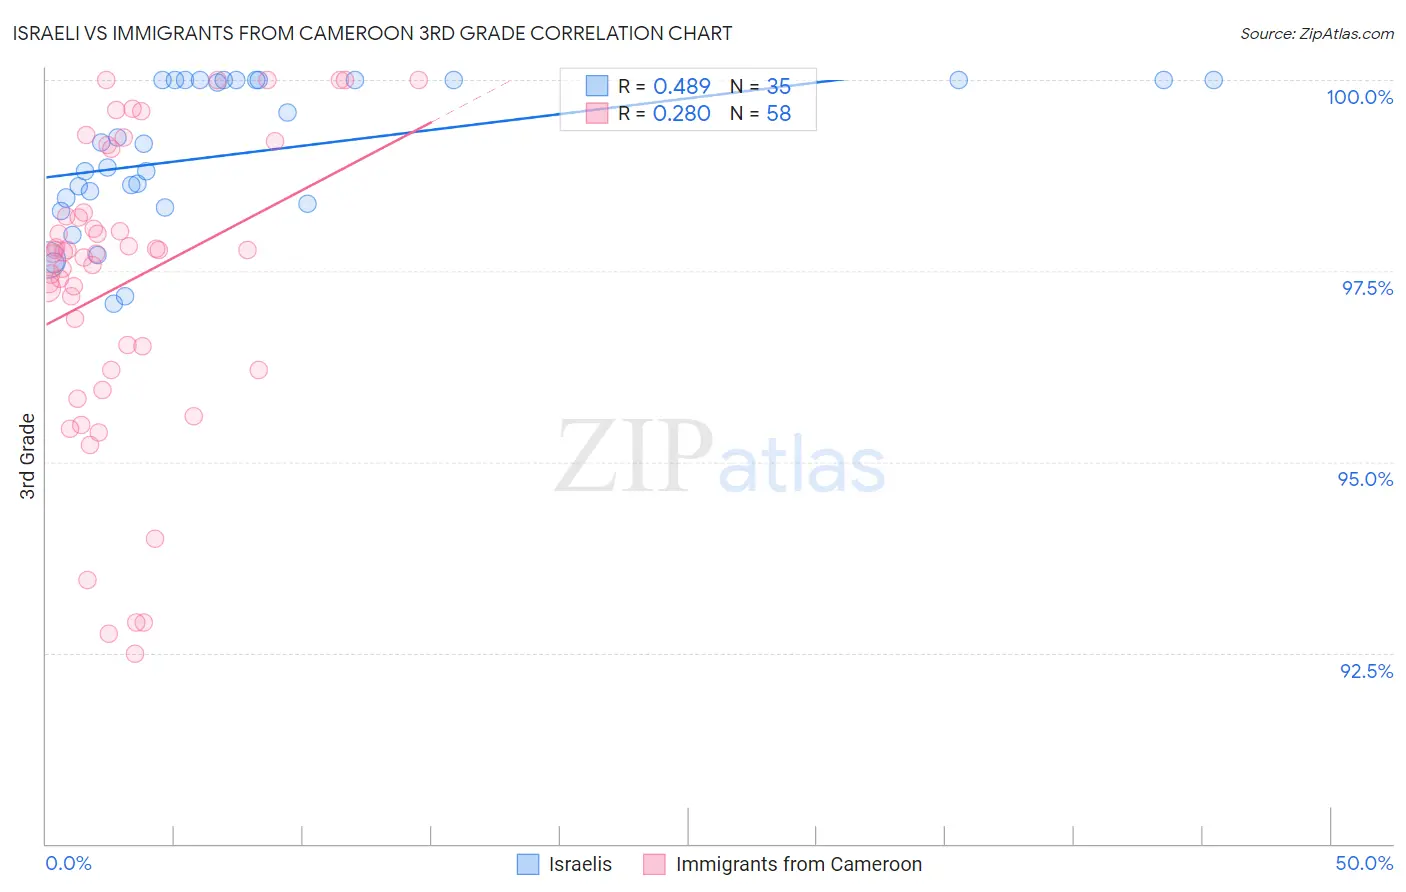
Israeli vs Immigrants from Cameroon 3rd Grade Correlation Chart
The statistical analysis conducted on geographies consisting of 211,219,690 people shows a moderate positive correlation between the proportion of Israelis and percentage of population with at least 3rd grade education in the United States with a correlation coefficient (R) of 0.489 and weighted average of 97.9%. Similarly, the statistical analysis conducted on geographies consisting of 130,752,798 people shows a weak positive correlation between the proportion of Immigrants from Cameroon and percentage of population with at least 3rd grade education in the United States with a correlation coefficient (R) of 0.280 and weighted average of 97.2%, a difference of 0.72%.
3rd Grade Correlation Summary
| Measurement | Israeli | Immigrants from Cameroon |
| Minimum | 97.1% | 92.5% |
| Maximum | 100.0% | 100.0% |
| Range | 2.9% | 7.5% |
| Mean | 99.0% | 97.3% |
| Median | 99.2% | 97.7% |
| Interquartile 25% (IQ1) | 98.4% | 96.2% |
| Interquartile 75% (IQ3) | 100.0% | 98.3% |
| Interquartile Range (IQR) | 1.6% | 2.1% |
| Standard Deviation (Sample) | 0.94% | 2.0% |
| Standard Deviation (Population) | 0.93% | 1.9% |
Similar Demographics by 3rd Grade
Demographics Similar to Israelis by 3rd Grade
In terms of 3rd grade, the demographic groups most similar to Israelis are Blackfeet (97.9%, a difference of 0.0%), Cambodian (97.9%, a difference of 0.010%), Spaniard (97.9%, a difference of 0.010%), Immigrants from Romania (97.9%, a difference of 0.010%), and Palestinian (97.9%, a difference of 0.010%).
| Demographics | Rating | Rank | 3rd Grade |
| Immigrants | Bulgaria | 89.1 /100 | #131 | Excellent 97.9% |
| Immigrants | Hungary | 88.8 /100 | #132 | Excellent 97.9% |
| Immigrants | Kuwait | 88.7 /100 | #133 | Excellent 97.9% |
| Seminole | 88.7 /100 | #134 | Excellent 97.9% |
| Cambodians | 88.1 /100 | #135 | Excellent 97.9% |
| Spaniards | 87.9 /100 | #136 | Excellent 97.9% |
| Immigrants | Romania | 87.9 /100 | #137 | Excellent 97.9% |
| Israelis | 86.6 /100 | #138 | Excellent 97.9% |
| Blackfeet | 86.3 /100 | #139 | Excellent 97.9% |
| Palestinians | 84.6 /100 | #140 | Excellent 97.9% |
| Immigrants | Turkey | 83.5 /100 | #141 | Excellent 97.9% |
| Hmong | 80.3 /100 | #142 | Excellent 97.9% |
| Filipinos | 79.9 /100 | #143 | Good 97.9% |
| Burmese | 79.6 /100 | #144 | Good 97.9% |
| Immigrants | Greece | 79.5 /100 | #145 | Good 97.9% |
Demographics Similar to Immigrants from Cameroon by 3rd Grade
In terms of 3rd grade, the demographic groups most similar to Immigrants from Cameroon are Immigrants from China (97.2%, a difference of 0.010%), Puerto Rican (97.2%, a difference of 0.010%), Ghanaian (97.2%, a difference of 0.010%), Immigrants from Peru (97.2%, a difference of 0.010%), and Immigrants from Uzbekistan (97.2%, a difference of 0.020%).
| Demographics | Rating | Rank | 3rd Grade |
| Immigrants | Nigeria | 0.3 /100 | #267 | Tragic 97.3% |
| Cubans | 0.2 /100 | #268 | Tragic 97.3% |
| Fijians | 0.2 /100 | #269 | Tragic 97.3% |
| Immigrants | China | 0.2 /100 | #270 | Tragic 97.2% |
| Puerto Ricans | 0.2 /100 | #271 | Tragic 97.2% |
| Ghanaians | 0.1 /100 | #272 | Tragic 97.2% |
| Immigrants | Peru | 0.1 /100 | #273 | Tragic 97.2% |
| Immigrants | Cameroon | 0.1 /100 | #274 | Tragic 97.2% |
| Immigrants | Uzbekistan | 0.1 /100 | #275 | Tragic 97.2% |
| Immigrants | Bolivia | 0.1 /100 | #276 | Tragic 97.2% |
| Trinidadians and Tobagonians | 0.1 /100 | #277 | Tragic 97.2% |
| Immigrants | Western Africa | 0.1 /100 | #278 | Tragic 97.2% |
| Immigrants | Philippines | 0.1 /100 | #279 | Tragic 97.2% |
| Immigrants | Ghana | 0.1 /100 | #280 | Tragic 97.2% |
| Barbadians | 0.1 /100 | #281 | Tragic 97.2% |