Israeli vs Immigrants from Australia Associate's Degree

COMPARE

Israeli
Race
Ancestry
AfghanAfricanAlaska NativeAlaskan AthabascanAlbanianAleutAlsatianAmericanApacheArabArapahoArgentineanArmenianAssyrian/Chaldean/SyriacAustralianAustrianBahamianBangladeshiBarbadianBasqueBelgianBelizeanBermudanBhutaneseBlackfeetBolivianBrazilianBritishBritish West IndianBulgarianBurmeseCajunCambodianCanadianCape VerdeanCarpatho RusynCelticCentral AmericanCentral American IndianCherokeeCheyenneChickasawChileanChineseChippewaChoctawColombianColvilleComancheCosta RicanCreeCreekCroatianCrowCubanCypriotCzechCzechoslovakianDanishDelawareDominicanDutchDutch West IndianEastern EuropeanEcuadorianEgyptianEnglishEstonianEthiopianEuropeanFijianFilipinoFinnishFrenchFrench American IndianFrench CanadianGermanGerman RussianGhanaianGreekGuamanian/ChamorroGuatemalanGuyaneseHaitianHmongHonduranHopiHoumaHungarianIcelanderIndian (Asian)IndonesianInupiatIranianIraqiIrishIroquoisIsraeliItalianJamaicanJapaneseJordanianKenyanKiowaKoreanLaotianLatvianLebaneseLiberianLithuanianLumbeeLuxembourgerMacedonianMalaysianMalteseMarshalleseMenomineeMexicanMexican American IndianMongolianMoroccanNative HawaiianNavajoNepaleseNew ZealanderNicaraguanNigerianNorthern EuropeanNorwegianOkinawanOsageOttawaPaiutePakistaniPalestinianPanamanianParaguayanPennsylvania GermanPeruvianPimaPolishPortuguesePotawatomiPuebloPuerto RicanPuget Sound SalishRomanianRussianSalvadoranSamoanScandinavianScotch-IrishScottishSeminoleSenegaleseSerbianShoshoneSierra LeoneanSiouxSlavicSlovakSloveneSomaliSouth AfricanSouth AmericanSouth American IndianSoviet UnionSpaniardSpanishSpanish AmericanSpanish American IndianSri LankanSubsaharan AfricanSudaneseSwedishSwissSyrianTaiwaneseThaiTlingit-HaidaTohono O'OdhamTonganTrinidadian and TobagonianTsimshianTurkishU.S. Virgin IslanderUgandanUkrainianUruguayanUteVenezuelanVietnameseWelshWest IndianYakamaYaquiYugoslavianYumanYup'ikZimbabwean
Immigration
NonimmigrantsImmigrantsAfghanistanAfricaAlbaniaArgentinaArmeniaAsiaAustriaBahamasBangladeshBarbadosBelarusBelgiumBelizeBoliviaBosnia and HerzegovinaBrazilBulgariaBurma/MyanmarCabo VerdeCambodiaCameroonCanadaCaribbeanCentral AmericaChileChinaColombiaCongoCosta RicaCroatiaCubaCzechoslovakiaDenmarkDominicaDominican RepublicEastern AfricaEastern AsiaEastern EuropeEcuadorEgyptEl SalvadorEnglandEritreaEthiopiaEuropeFijiFranceGermanyGhanaGreeceGrenadaGuatemalaGuyanaHaitiHondurasHong KongHungaryIndiaIndonesiaIranIraqIrelandIsraelItalyJamaicaJapanJordanKazakhstanKenyaKoreaKuwaitLaosLatin AmericaLatviaLebanonLiberiaLithuaniaMalaysiaMexicoMicronesiaMiddle AfricaMoldovaMoroccoNepalNetherlandsNicaraguaNigeriaNorth AmericaNorth MacedoniaNorthern AfricaNorthern EuropeNorwayOceaniaPakistanPanamaPeruPhilippinesPolandPortugalRomaniaRussiaSaudi ArabiaScotlandSenegalSerbiaSierra LeoneSingaporeSomaliaSouth AfricaSouth AmericaSouth Central AsiaSouth Eastern AsiaSouthern EuropeSpainSri LankaSt. Vincent and the GrenadinesSudanSwedenSwitzerlandSyriaTaiwanThailandTrinidad and TobagoTurkeyUgandaUkraineUruguayUzbekistanVenezuelaVietnamWest IndiesWestern AfricaWestern AsiaWestern EuropeYemenZaireZimbabweAzores
Immigrants from Australia
Race
Ancestry
AfghanAfricanAlaska NativeAlaskan AthabascanAlbanianAleutAlsatianAmericanApacheArabArapahoArgentineanArmenianAssyrian/Chaldean/SyriacAustralianAustrianBahamianBangladeshiBarbadianBasqueBelgianBelizeanBermudanBhutaneseBlackfeetBolivianBrazilianBritishBritish West IndianBulgarianBurmeseCajunCambodianCanadianCape VerdeanCarpatho RusynCelticCentral AmericanCentral American IndianCherokeeCheyenneChickasawChileanChineseChippewaChoctawColombianColvilleComancheCosta RicanCreeCreekCroatianCrowCubanCypriotCzechCzechoslovakianDanishDelawareDominicanDutchDutch West IndianEastern EuropeanEcuadorianEgyptianEnglishEstonianEthiopianEuropeanFijianFilipinoFinnishFrenchFrench American IndianFrench CanadianGermanGerman RussianGhanaianGreekGuamanian/ChamorroGuatemalanGuyaneseHaitianHmongHonduranHopiHoumaHungarianIcelanderIndian (Asian)IndonesianInupiatIranianIraqiIrishIroquoisItalianJamaicanJapaneseJordanianKenyanKiowaKoreanLaotianLatvianLebaneseLiberianLithuanianLumbeeLuxembourgerMacedonianMalaysianMalteseMarshalleseMenomineeMexicanMexican American IndianMongolianMoroccanNative HawaiianNavajoNepaleseNew ZealanderNicaraguanNigerianNorthern EuropeanNorwegianOkinawanOsageOttawaPaiutePakistaniPalestinianPanamanianParaguayanPennsylvania GermanPeruvianPimaPolishPortuguesePotawatomiPuebloPuerto RicanPuget Sound SalishRomanianRussianSalvadoranSamoanScandinavianScotch-IrishScottishSeminoleSenegaleseSerbianShoshoneSierra LeoneanSiouxSlavicSlovakSloveneSomaliSouth AfricanSouth AmericanSouth American IndianSoviet UnionSpaniardSpanishSpanish AmericanSpanish American IndianSri LankanSubsaharan AfricanSudaneseSwedishSwissSyrianTaiwaneseThaiTlingit-HaidaTohono O'OdhamTonganTrinidadian and TobagonianTsimshianTurkishU.S. Virgin IslanderUgandanUkrainianUruguayanUteVenezuelanVietnameseWelshWest IndianYakamaYaquiYugoslavianYumanYup'ikZimbabwean
Immigration
NonimmigrantsImmigrantsAfghanistanAfricaAlbaniaArgentinaArmeniaAsiaAustraliaAustriaBahamasBangladeshBarbadosBelarusBelgiumBelizeBoliviaBosnia and HerzegovinaBrazilBulgariaBurma/MyanmarCabo VerdeCambodiaCameroonCanadaCaribbeanCentral AmericaChileChinaColombiaCongoCosta RicaCroatiaCubaCzechoslovakiaDenmarkDominicaDominican RepublicEastern AfricaEastern AsiaEastern EuropeEcuadorEgyptEl SalvadorEnglandEritreaEthiopiaEuropeFijiFranceGermanyGhanaGreeceGrenadaGuatemalaGuyanaHaitiHondurasHong KongHungaryIndiaIndonesiaIranIraqIrelandIsraelItalyJamaicaJapanJordanKazakhstanKenyaKoreaKuwaitLaosLatin AmericaLatviaLebanonLiberiaLithuaniaMalaysiaMexicoMicronesiaMiddle AfricaMoldovaMoroccoNepalNetherlandsNicaraguaNigeriaNorth AmericaNorth MacedoniaNorthern AfricaNorthern EuropeNorwayOceaniaPakistanPanamaPeruPhilippinesPolandPortugalRomaniaRussiaSaudi ArabiaScotlandSenegalSerbiaSierra LeoneSingaporeSomaliaSouth AfricaSouth AmericaSouth Central AsiaSouth Eastern AsiaSouthern EuropeSpainSri LankaSt. Vincent and the GrenadinesSudanSwedenSwitzerlandSyriaTaiwanThailandTrinidad and TobagoTurkeyUgandaUkraineUruguayUzbekistanVenezuelaVietnamWest IndiesWestern AfricaWestern AsiaWestern EuropeYemenZaireZimbabweAzores
Associate's Degree
Income
Poverty
Unemployment
Labor Participation
Family Structure
Vehicle Availability
Education Level
Disability

Associate's Degree Comparison

Israelis

Immigrants from Australia

Exceptional
Exceptional
53.4%
ASSOCIATE'S DEGREE
100.0/ 100
METRIC RATING
33rd/ 347
METRIC RANK
55.8%
ASSOCIATE'S DEGREE
100.0/ 100
METRIC RATING
11th/ 347
METRIC RANK

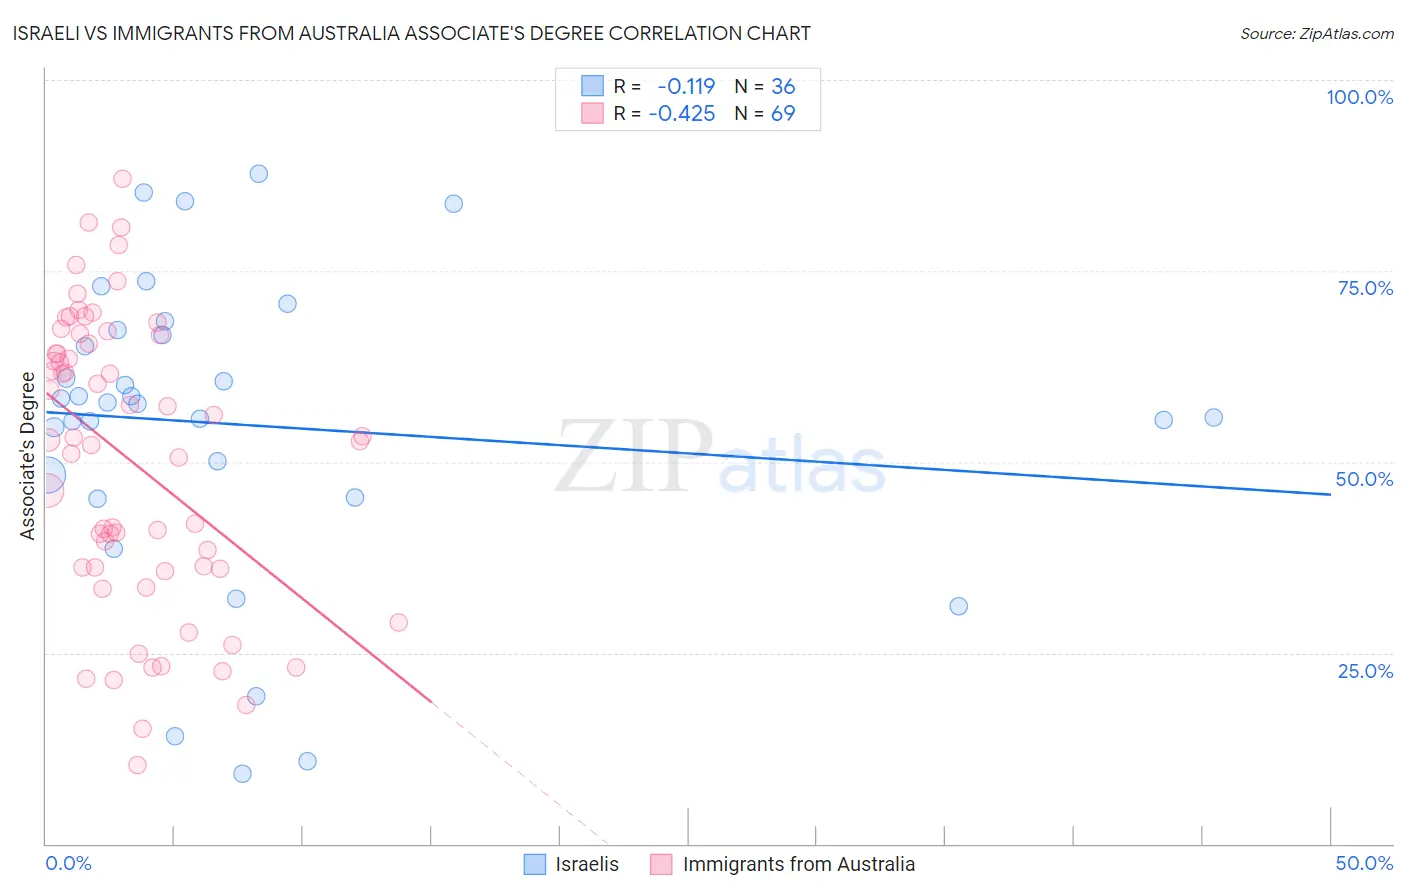
Israeli vs Immigrants from Australia Associate's Degree Correlation Chart

The statistical analysis conducted on geographies consisting of 211,190,630 people shows a poor negative correlation between the proportion of Israelis and percentage of population with at least associate's degree education in the United States with a correlation coefficient (R) of -0.119 and weighted average of 53.4%. Similarly, the statistical analysis conducted on geographies consisting of 227,202,570 people shows a moderate negative correlation between the proportion of Immigrants from Australia and percentage of population with at least associate's degree education in the United States with a correlation coefficient (R) of -0.425 and weighted average of 55.8%, a difference of 4.5%.
Israeli vs Immigrants from Australia Associate's Degree

Associate's Degree Correlation Summary

MeasurementIsraeliImmigrants from Australia
Minimum9.1%10.3%
Maximum87.7%87.2%
Range78.6%76.8%
Mean54.8%50.2%
Median57.7%52.9%
Interquartile 25% (IQ1)46.9%36.0%
Interquartile 75% (IQ3)66.9%66.1%
Interquartile Range (IQR)20.0%30.0%
Standard Deviation (Sample)19.9%18.8%
Standard Deviation (Population)19.7%18.7%

Similar Demographics by Associate's Degree

Demographics Similar to Israelis by Associate's Degree

In terms of associate's degree, the demographic groups most similar to Israelis are Immigrants from Turkey (53.4%, a difference of 0.12%), Immigrants from Northern Europe (53.5%, a difference of 0.15%), Bulgarian (53.3%, a difference of 0.19%), Russian (53.2%, a difference of 0.26%), and Immigrants from Sri Lanka (53.7%, a difference of 0.51%).
DemographicsRating | RankAssociate's Degree
Immigrants | Belgium
100.0
/100
|
#26
Exceptional
54.5%
Latvians
100.0
/100
|
#27
Exceptional
53.9%
Turks
100.0
/100
|
#28
Exceptional
53.9%
Immigrants | France
100.0
/100
|
#29
Exceptional
53.9%
Immigrants | Sri Lanka
100.0
/100
|
#30
Exceptional
53.7%
Immigrants | Northern Europe
100.0
/100
|
#31
Exceptional
53.5%
Immigrants | Turkey
100.0
/100
|
#32
Exceptional
53.4%
Israelis
100.0
/100
|
#33
Exceptional
53.4%
Bulgarians
100.0
/100
|
#34
Exceptional
53.3%
Russians
100.0
/100
|
#35
Exceptional
53.2%
Immigrants | Russia
100.0
/100
|
#36
Exceptional
53.1%
Immigrants | Denmark
100.0
/100
|
#37
Exceptional
53.1%
Mongolians
100.0
/100
|
#38
Exceptional
53.0%
Immigrants | Belarus
99.9
/100
|
#39
Exceptional
52.8%
Immigrants | Latvia
99.9
/100
|
#40
Exceptional
52.8%

Demographics Similar to Immigrants from Australia by Associate's Degree

In terms of associate's degree, the demographic groups most similar to Immigrants from Australia are Immigrants from South Central Asia (55.7%, a difference of 0.12%), Immigrants from China (55.5%, a difference of 0.61%), Immigrants from Hong Kong (55.4%, a difference of 0.76%), Immigrants from Eastern Asia (55.4%, a difference of 0.79%), and Cypriot (56.4%, a difference of 1.0%).
DemographicsRating | RankAssociate's Degree
Immigrants | Taiwan
100.0
/100
|
#4
Exceptional
58.4%
Iranians
100.0
/100
|
#5
Exceptional
58.2%
Okinawans
100.0
/100
|
#6
Exceptional
57.7%
Immigrants | Iran
100.0
/100
|
#7
Exceptional
57.7%
Thais
100.0
/100
|
#8
Exceptional
57.4%
Immigrants | Israel
100.0
/100
|
#9
Exceptional
56.8%
Cypriots
100.0
/100
|
#10
Exceptional
56.4%
Immigrants | Australia
100.0
/100
|
#11
Exceptional
55.8%
Immigrants | South Central Asia
100.0
/100
|
#12
Exceptional
55.7%
Immigrants | China
100.0
/100
|
#13
Exceptional
55.5%
Immigrants | Hong Kong
100.0
/100
|
#14
Exceptional
55.4%
Immigrants | Eastern Asia
100.0
/100
|
#15
Exceptional
55.4%
Soviet Union
100.0
/100
|
#16
Exceptional
55.1%
Eastern Europeans
100.0
/100
|
#17
Exceptional
55.0%
Indians (Asian)
100.0
/100
|
#18
Exceptional
54.8%