Israeli vs Hopi 9th Grade

COMPARE

Israeli
Race
Ancestry
AfghanAfricanAlaska NativeAlaskan AthabascanAlbanianAleutAlsatianAmericanApacheArabArapahoArgentineanArmenianAssyrian/Chaldean/SyriacAustralianAustrianBahamianBangladeshiBarbadianBasqueBelgianBelizeanBermudanBhutaneseBlackfeetBolivianBrazilianBritishBritish West IndianBulgarianBurmeseCajunCambodianCanadianCape VerdeanCarpatho RusynCelticCentral AmericanCentral American IndianCherokeeCheyenneChickasawChileanChineseChippewaChoctawColombianColvilleComancheCosta RicanCreeCreekCroatianCrowCubanCypriotCzechCzechoslovakianDanishDelawareDominicanDutchDutch West IndianEastern EuropeanEcuadorianEgyptianEnglishEstonianEthiopianEuropeanFijianFilipinoFinnishFrenchFrench American IndianFrench CanadianGermanGerman RussianGhanaianGreekGuamanian/ChamorroGuatemalanGuyaneseHaitianHmongHonduranHoumaHungarianIcelanderIndian (Asian)IndonesianInupiatIranianIraqiIrishIroquoisIsraeliItalianJamaicanJapaneseJordanianKenyanKiowaKoreanLaotianLatvianLebaneseLiberianLithuanianLumbeeLuxembourgerMacedonianMalaysianMalteseMarshalleseMenomineeMexicanMexican American IndianMongolianMoroccanNative HawaiianNavajoNepaleseNew ZealanderNicaraguanNigerianNorthern EuropeanNorwegianOkinawanOsageOttawaPaiutePakistaniPalestinianPanamanianParaguayanPennsylvania GermanPeruvianPimaPolishPortuguesePotawatomiPuebloPuerto RicanPuget Sound SalishRomanianRussianSalvadoranSamoanScandinavianScotch-IrishScottishSeminoleSenegaleseSerbianShoshoneSierra LeoneanSiouxSlavicSlovakSloveneSomaliSouth AfricanSouth AmericanSouth American IndianSoviet UnionSpaniardSpanishSpanish AmericanSpanish American IndianSri LankanSubsaharan AfricanSudaneseSwedishSwissSyrianTaiwaneseThaiTlingit-HaidaTohono O'OdhamTonganTrinidadian and TobagonianTsimshianTurkishU.S. Virgin IslanderUgandanUkrainianUruguayanUteVenezuelanVietnameseWelshWest IndianYakamaYaquiYugoslavianYumanYup'ikZimbabwean
Immigration
NonimmigrantsImmigrantsAfghanistanAfricaAlbaniaArgentinaArmeniaAsiaAustraliaAustriaBahamasBangladeshBarbadosBelarusBelgiumBelizeBoliviaBosnia and HerzegovinaBrazilBulgariaBurma/MyanmarCabo VerdeCambodiaCameroonCanadaCaribbeanCentral AmericaChileChinaColombiaCongoCosta RicaCroatiaCubaCzechoslovakiaDenmarkDominicaDominican RepublicEastern AfricaEastern AsiaEastern EuropeEcuadorEgyptEl SalvadorEnglandEritreaEthiopiaEuropeFijiFranceGermanyGhanaGreeceGrenadaGuatemalaGuyanaHaitiHondurasHong KongHungaryIndiaIndonesiaIranIraqIrelandIsraelItalyJamaicaJapanJordanKazakhstanKenyaKoreaKuwaitLaosLatin AmericaLatviaLebanonLiberiaLithuaniaMalaysiaMexicoMicronesiaMiddle AfricaMoldovaMoroccoNepalNetherlandsNicaraguaNigeriaNorth AmericaNorth MacedoniaNorthern AfricaNorthern EuropeNorwayOceaniaPakistanPanamaPeruPhilippinesPolandPortugalRomaniaRussiaSaudi ArabiaScotlandSenegalSerbiaSierra LeoneSingaporeSomaliaSouth AfricaSouth AmericaSouth Central AsiaSouth Eastern AsiaSouthern EuropeSpainSri LankaSt. Vincent and the GrenadinesSudanSwedenSwitzerlandSyriaTaiwanThailandTrinidad and TobagoTurkeyUgandaUkraineUruguayUzbekistanVenezuelaVietnamWest IndiesWestern AfricaWestern AsiaWestern EuropeYemenZaireZimbabweAzores
Hopi
Race
Ancestry
AfghanAfricanAlaska NativeAlaskan AthabascanAlbanianAleutAlsatianAmericanApacheArabArapahoArgentineanArmenianAssyrian/Chaldean/SyriacAustralianAustrianBahamianBangladeshiBarbadianBasqueBelgianBelizeanBermudanBhutaneseBlackfeetBolivianBrazilianBritishBritish West IndianBulgarianBurmeseCajunCambodianCanadianCape VerdeanCarpatho RusynCelticCentral AmericanCentral American IndianCherokeeCheyenneChickasawChileanChineseChippewaChoctawColombianColvilleComancheCosta RicanCreeCreekCroatianCrowCubanCypriotCzechCzechoslovakianDanishDelawareDominicanDutchDutch West IndianEastern EuropeanEcuadorianEgyptianEnglishEstonianEthiopianEuropeanFijianFilipinoFinnishFrenchFrench American IndianFrench CanadianGermanGerman RussianGhanaianGreekGuamanian/ChamorroGuatemalanGuyaneseHaitianHmongHonduranHopiHoumaHungarianIcelanderIndian (Asian)IndonesianInupiatIranianIraqiIrishIroquoisItalianJamaicanJapaneseJordanianKenyanKiowaKoreanLaotianLatvianLebaneseLiberianLithuanianLumbeeLuxembourgerMacedonianMalaysianMalteseMarshalleseMenomineeMexicanMexican American IndianMongolianMoroccanNative HawaiianNavajoNepaleseNew ZealanderNicaraguanNigerianNorthern EuropeanNorwegianOkinawanOsageOttawaPaiutePakistaniPalestinianPanamanianParaguayanPennsylvania GermanPeruvianPimaPolishPortuguesePotawatomiPuebloPuerto RicanPuget Sound SalishRomanianRussianSalvadoranSamoanScandinavianScotch-IrishScottishSeminoleSenegaleseSerbianShoshoneSierra LeoneanSiouxSlavicSlovakSloveneSomaliSouth AfricanSouth AmericanSouth American IndianSoviet UnionSpaniardSpanishSpanish AmericanSpanish American IndianSri LankanSubsaharan AfricanSudaneseSwedishSwissSyrianTaiwaneseThaiTlingit-HaidaTohono O'OdhamTonganTrinidadian and TobagonianTsimshianTurkishU.S. Virgin IslanderUgandanUkrainianUruguayanUteVenezuelanVietnameseWelshWest IndianYakamaYaquiYugoslavianYumanYup'ikZimbabwean
Immigration
NonimmigrantsImmigrantsAfghanistanAfricaAlbaniaArgentinaArmeniaAsiaAustraliaAustriaBahamasBangladeshBarbadosBelarusBelgiumBelizeBoliviaBosnia and HerzegovinaBrazilBulgariaBurma/MyanmarCabo VerdeCambodiaCameroonCanadaCaribbeanCentral AmericaChileChinaColombiaCongoCosta RicaCroatiaCubaCzechoslovakiaDenmarkDominicaDominican RepublicEastern AfricaEastern AsiaEastern EuropeEcuadorEgyptEl SalvadorEnglandEritreaEthiopiaEuropeFijiFranceGermanyGhanaGreeceGrenadaGuatemalaGuyanaHaitiHondurasHong KongHungaryIndiaIndonesiaIranIraqIrelandIsraelItalyJamaicaJapanJordanKazakhstanKenyaKoreaKuwaitLaosLatin AmericaLatviaLebanonLiberiaLithuaniaMalaysiaMexicoMicronesiaMiddle AfricaMoldovaMoroccoNepalNetherlandsNicaraguaNigeriaNorth AmericaNorth MacedoniaNorthern AfricaNorthern EuropeNorwayOceaniaPakistanPanamaPeruPhilippinesPolandPortugalRomaniaRussiaSaudi ArabiaScotlandSenegalSerbiaSierra LeoneSingaporeSomaliaSouth AfricaSouth AmericaSouth Central AsiaSouth Eastern AsiaSouthern EuropeSpainSri LankaSt. Vincent and the GrenadinesSudanSwedenSwitzerlandSyriaTaiwanThailandTrinidad and TobagoTurkeyUgandaUkraineUruguayUzbekistanVenezuelaVietnamWest IndiesWestern AfricaWestern AsiaWestern EuropeYemenZaireZimbabweAzores
9th Grade
Income
Poverty
Unemployment
Labor Participation
Family Structure
Vehicle Availability
Education Level
Disability

9th Grade Comparison

Israelis

Hopi

Exceptional
Fair
95.3%
9TH GRADE
90.4/ 100
METRIC RATING
133rd/ 347
METRIC RANK
94.8%
9TH GRADE
37.1/ 100
METRIC RATING
186th/ 347
METRIC RANK

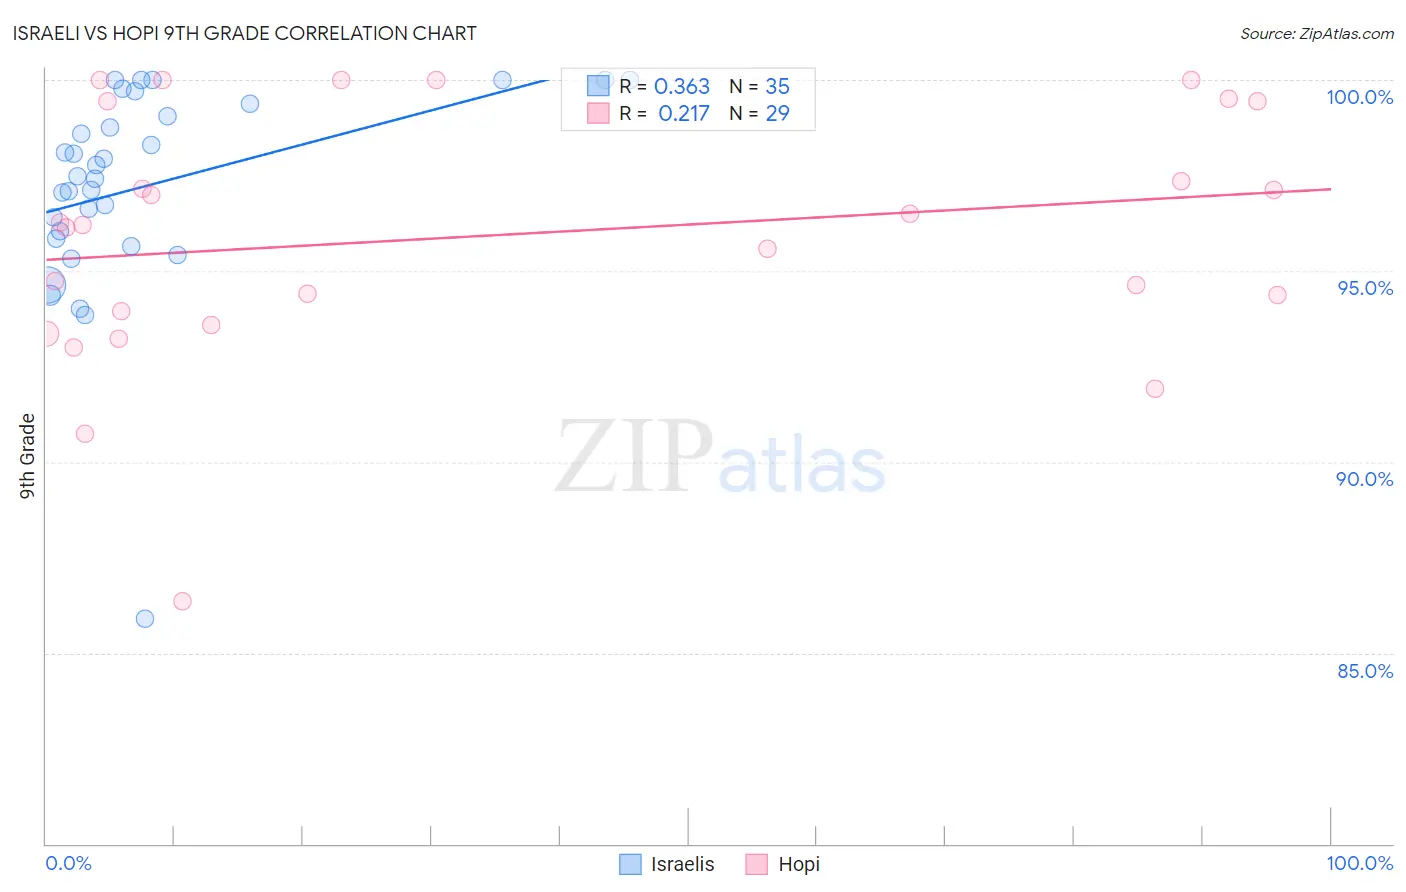
Israeli vs Hopi 9th Grade Correlation Chart

The statistical analysis conducted on geographies consisting of 211,220,151 people shows a mild positive correlation between the proportion of Israelis and percentage of population with at least 9th grade education in the United States with a correlation coefficient (R) of 0.363 and weighted average of 95.3%. Similarly, the statistical analysis conducted on geographies consisting of 74,739,957 people shows a weak positive correlation between the proportion of Hopi and percentage of population with at least 9th grade education in the United States with a correlation coefficient (R) of 0.217 and weighted average of 94.8%, a difference of 0.51%.
Israeli vs Hopi 9th Grade

9th Grade Correlation Summary

MeasurementIsraeliHopi
Minimum85.9%86.4%
Maximum100.0%100.0%
Range14.1%13.6%
Mean97.2%95.9%
Median97.5%96.2%
Interquartile 25% (IQ1)95.8%93.8%
Interquartile 75% (IQ3)99.4%99.4%
Interquartile Range (IQR)3.5%5.7%
Standard Deviation (Sample)2.7%3.3%
Standard Deviation (Population)2.7%3.2%

Similar Demographics by 9th Grade

Demographics Similar to Israelis by 9th Grade

In terms of 9th grade, the demographic groups most similar to Israelis are Immigrants from Israel (95.3%, a difference of 0.020%), Nonimmigrants (95.3%, a difference of 0.030%), Immigrants from Belarus (95.2%, a difference of 0.030%), Immigrants from North Macedonia (95.3%, a difference of 0.040%), and Immigrants from Iran (95.2%, a difference of 0.040%).
DemographicsRating | Rank9th Grade
Immigrants | Serbia
94.4
/100
|
#126
Exceptional
95.4%
Palestinians
94.3
/100
|
#127
Exceptional
95.4%
Immigrants | Hungary
94.2
/100
|
#128
Exceptional
95.4%
Basques
94.1
/100
|
#129
Exceptional
95.4%
Jordanians
93.5
/100
|
#130
Exceptional
95.3%
Immigrants | North Macedonia
92.3
/100
|
#131
Exceptional
95.3%
Immigrants | Nonimmigrants
92.0
/100
|
#132
Exceptional
95.3%
Israelis
90.4
/100
|
#133
Exceptional
95.3%
Immigrants | Israel
89.6
/100
|
#134
Excellent
95.3%
Immigrants | Belarus
88.9
/100
|
#135
Excellent
95.2%
Immigrants | Iran
88.3
/100
|
#136
Excellent
95.2%
Hmong
87.7
/100
|
#137
Excellent
95.2%
Immigrants | Russia
86.6
/100
|
#138
Excellent
95.2%
Immigrants | Eastern Europe
85.8
/100
|
#139
Excellent
95.2%
Immigrants | Taiwan
85.3
/100
|
#140
Excellent
95.2%

Demographics Similar to Hopi by 9th Grade

In terms of 9th grade, the demographic groups most similar to Hopi are Argentinean (94.8%, a difference of 0.0%), Liberian (94.8%, a difference of 0.0%), Guamanian/Chamorro (94.8%, a difference of 0.010%), Immigrants from Nepal (94.8%, a difference of 0.020%), and Immigrants from Albania (94.8%, a difference of 0.020%).
DemographicsRating | Rank9th Grade
Immigrants | Venezuela
46.5
/100
|
#179
Average
94.9%
Immigrants | Uganda
43.1
/100
|
#180
Average
94.8%
Sierra Leoneans
42.7
/100
|
#181
Average
94.8%
Seminole
42.5
/100
|
#182
Average
94.8%
Immigrants | Nepal
39.7
/100
|
#183
Fair
94.8%
Argentineans
37.6
/100
|
#184
Fair
94.8%
Liberians
37.4
/100
|
#185
Fair
94.8%
Hopi
37.1
/100
|
#186
Fair
94.8%
Guamanians/Chamorros
35.5
/100
|
#187
Fair
94.8%
Immigrants | Albania
34.5
/100
|
#188
Fair
94.8%
Immigrants | Argentina
34.4
/100
|
#189
Fair
94.8%
Sudanese
32.7
/100
|
#190
Fair
94.7%
Assyrians/Chaldeans/Syriacs
32.0
/100
|
#191
Fair
94.7%
Immigrants | Northern Africa
30.7
/100
|
#192
Fair
94.7%
Paraguayans
30.1
/100
|
#193
Fair
94.7%