Iraqi vs Immigrants from Cuba 8th Grade

COMPARE

Iraqi
Race
Ancestry
AfghanAfricanAlaska NativeAlaskan AthabascanAlbanianAleutAlsatianAmericanApacheArabArapahoArgentineanArmenianAssyrian/Chaldean/SyriacAustralianAustrianBahamianBangladeshiBarbadianBasqueBelgianBelizeanBermudanBhutaneseBlackfeetBolivianBrazilianBritishBritish West IndianBulgarianBurmeseCajunCambodianCanadianCape VerdeanCarpatho RusynCelticCentral AmericanCentral American IndianCherokeeCheyenneChickasawChileanChineseChippewaChoctawColombianColvilleComancheCosta RicanCreeCreekCroatianCrowCubanCypriotCzechCzechoslovakianDanishDelawareDominicanDutchDutch West IndianEastern EuropeanEcuadorianEgyptianEnglishEstonianEthiopianEuropeanFijianFilipinoFinnishFrenchFrench American IndianFrench CanadianGermanGerman RussianGhanaianGreekGuamanian/ChamorroGuatemalanGuyaneseHaitianHmongHonduranHopiHoumaHungarianIcelanderIndian (Asian)IndonesianInupiatIranianIraqiIrishIroquoisIsraeliItalianJamaicanJapaneseJordanianKenyanKiowaKoreanLaotianLatvianLebaneseLiberianLithuanianLumbeeLuxembourgerMacedonianMalaysianMalteseMarshalleseMenomineeMexicanMexican American IndianMongolianMoroccanNative HawaiianNavajoNepaleseNew ZealanderNicaraguanNigerianNorthern EuropeanNorwegianOkinawanOsageOttawaPaiutePakistaniPalestinianPanamanianParaguayanPennsylvania GermanPeruvianPimaPolishPortuguesePotawatomiPuebloPuerto RicanPuget Sound SalishRomanianRussianSalvadoranSamoanScandinavianScotch-IrishScottishSeminoleSenegaleseSerbianShoshoneSierra LeoneanSiouxSlavicSlovakSloveneSomaliSouth AfricanSouth AmericanSouth American IndianSoviet UnionSpaniardSpanishSpanish AmericanSpanish American IndianSri LankanSubsaharan AfricanSudaneseSwedishSwissSyrianTaiwaneseThaiTlingit-HaidaTohono O'OdhamTonganTrinidadian and TobagonianTsimshianTurkishU.S. Virgin IslanderUgandanUkrainianUruguayanUteVenezuelanVietnameseWelshWest IndianYakamaYaquiYugoslavianYumanYup'ikZimbabwean
Immigration
NonimmigrantsImmigrantsAfghanistanAfricaAlbaniaArgentinaArmeniaAsiaAustraliaAustriaBahamasBangladeshBarbadosBelarusBelgiumBelizeBoliviaBosnia and HerzegovinaBrazilBulgariaBurma/MyanmarCabo VerdeCambodiaCameroonCanadaCaribbeanCentral AmericaChileChinaColombiaCongoCosta RicaCroatiaCzechoslovakiaDenmarkDominicaDominican RepublicEastern AfricaEastern AsiaEastern EuropeEcuadorEgyptEl SalvadorEnglandEritreaEthiopiaEuropeFijiFranceGermanyGhanaGreeceGrenadaGuatemalaGuyanaHaitiHondurasHong KongHungaryIndiaIndonesiaIranIraqIrelandIsraelItalyJamaicaJapanJordanKazakhstanKenyaKoreaKuwaitLaosLatin AmericaLatviaLebanonLiberiaLithuaniaMalaysiaMexicoMicronesiaMiddle AfricaMoldovaMoroccoNepalNetherlandsNicaraguaNigeriaNorth AmericaNorth MacedoniaNorthern AfricaNorthern EuropeNorwayOceaniaPakistanPanamaPeruPhilippinesPolandPortugalRomaniaRussiaSaudi ArabiaScotlandSenegalSerbiaSierra LeoneSingaporeSomaliaSouth AfricaSouth AmericaSouth Central AsiaSouth Eastern AsiaSouthern EuropeSpainSri LankaSt. Vincent and the GrenadinesSudanSwedenSwitzerlandSyriaTaiwanThailandTrinidad and TobagoTurkeyUgandaUkraineUruguayUzbekistanVenezuelaVietnamWest IndiesWestern AfricaWestern AsiaWestern EuropeYemenZaireZimbabweAzores
Immigrants from Cuba
Race
Ancestry
AfghanAfricanAlaska NativeAlaskan AthabascanAlbanianAleutAlsatianAmericanApacheArabArapahoArgentineanArmenianAssyrian/Chaldean/SyriacAustralianAustrianBahamianBangladeshiBarbadianBasqueBelgianBelizeanBermudanBhutaneseBlackfeetBolivianBrazilianBritishBritish West IndianBulgarianBurmeseCajunCambodianCanadianCape VerdeanCarpatho RusynCelticCentral AmericanCentral American IndianCherokeeCheyenneChickasawChileanChineseChippewaChoctawColombianColvilleComancheCosta RicanCreeCreekCroatianCrowCubanCypriotCzechCzechoslovakianDanishDelawareDominicanDutchDutch West IndianEastern EuropeanEcuadorianEgyptianEnglishEstonianEthiopianEuropeanFijianFilipinoFinnishFrenchFrench American IndianFrench CanadianGermanGerman RussianGhanaianGreekGuamanian/ChamorroGuatemalanGuyaneseHaitianHmongHonduranHopiHoumaHungarianIcelanderIndian (Asian)IndonesianInupiatIranianIrishIroquoisIsraeliItalianJamaicanJapaneseJordanianKenyanKiowaKoreanLaotianLatvianLebaneseLiberianLithuanianLumbeeLuxembourgerMacedonianMalaysianMalteseMarshalleseMenomineeMexicanMexican American IndianMongolianMoroccanNative HawaiianNavajoNepaleseNew ZealanderNicaraguanNigerianNorthern EuropeanNorwegianOkinawanOsageOttawaPaiutePakistaniPalestinianPanamanianParaguayanPennsylvania GermanPeruvianPimaPolishPortuguesePotawatomiPuebloPuerto RicanPuget Sound SalishRomanianRussianSalvadoranSamoanScandinavianScotch-IrishScottishSeminoleSenegaleseSerbianShoshoneSierra LeoneanSiouxSlavicSlovakSloveneSomaliSouth AfricanSouth AmericanSouth American IndianSoviet UnionSpaniardSpanishSpanish AmericanSpanish American IndianSri LankanSubsaharan AfricanSudaneseSwedishSwissSyrianTaiwaneseThaiTlingit-HaidaTohono O'OdhamTonganTrinidadian and TobagonianTsimshianTurkishU.S. Virgin IslanderUgandanUkrainianUruguayanUteVenezuelanVietnameseWelshWest IndianYakamaYaquiYugoslavianYumanYup'ikZimbabwean
Immigration
NonimmigrantsImmigrantsAfghanistanAfricaAlbaniaArgentinaArmeniaAsiaAustraliaAustriaBahamasBangladeshBarbadosBelarusBelgiumBelizeBoliviaBosnia and HerzegovinaBrazilBulgariaBurma/MyanmarCabo VerdeCambodiaCameroonCanadaCaribbeanCentral AmericaChileChinaColombiaCongoCosta RicaCroatiaCubaCzechoslovakiaDenmarkDominicaDominican RepublicEastern AfricaEastern AsiaEastern EuropeEcuadorEgyptEl SalvadorEnglandEritreaEthiopiaEuropeFijiFranceGermanyGhanaGreeceGrenadaGuatemalaGuyanaHaitiHondurasHong KongHungaryIndiaIndonesiaIranIraqIrelandIsraelItalyJamaicaJapanJordanKazakhstanKenyaKoreaKuwaitLaosLatin AmericaLatviaLebanonLiberiaLithuaniaMalaysiaMexicoMicronesiaMiddle AfricaMoldovaMoroccoNepalNetherlandsNicaraguaNigeriaNorth AmericaNorth MacedoniaNorthern AfricaNorthern EuropeNorwayOceaniaPakistanPanamaPeruPhilippinesPolandPortugalRomaniaRussiaSaudi ArabiaScotlandSenegalSerbiaSierra LeoneSingaporeSomaliaSouth AfricaSouth AmericaSouth Central AsiaSouth Eastern AsiaSouthern EuropeSpainSri LankaSt. Vincent and the GrenadinesSudanSwedenSwitzerlandSyriaTaiwanThailandTrinidad and TobagoTurkeyUgandaUkraineUruguayUzbekistanVenezuelaVietnamWest IndiesWestern AfricaWestern AsiaWestern EuropeYemenZaireZimbabweAzores
8th Grade
Income
Poverty
Unemployment
Labor Participation
Family Structure
Vehicle Availability
Education Level
Disability

8th Grade Comparison

Iraqis

Immigrants from Cuba

Average
Tragic
95.7%
8TH GRADE
40.5/ 100
METRIC RATING
180th/ 347
METRIC RANK
93.2%
8TH GRADE
0.0/ 100
METRIC RATING
319th/ 347
METRIC RANK

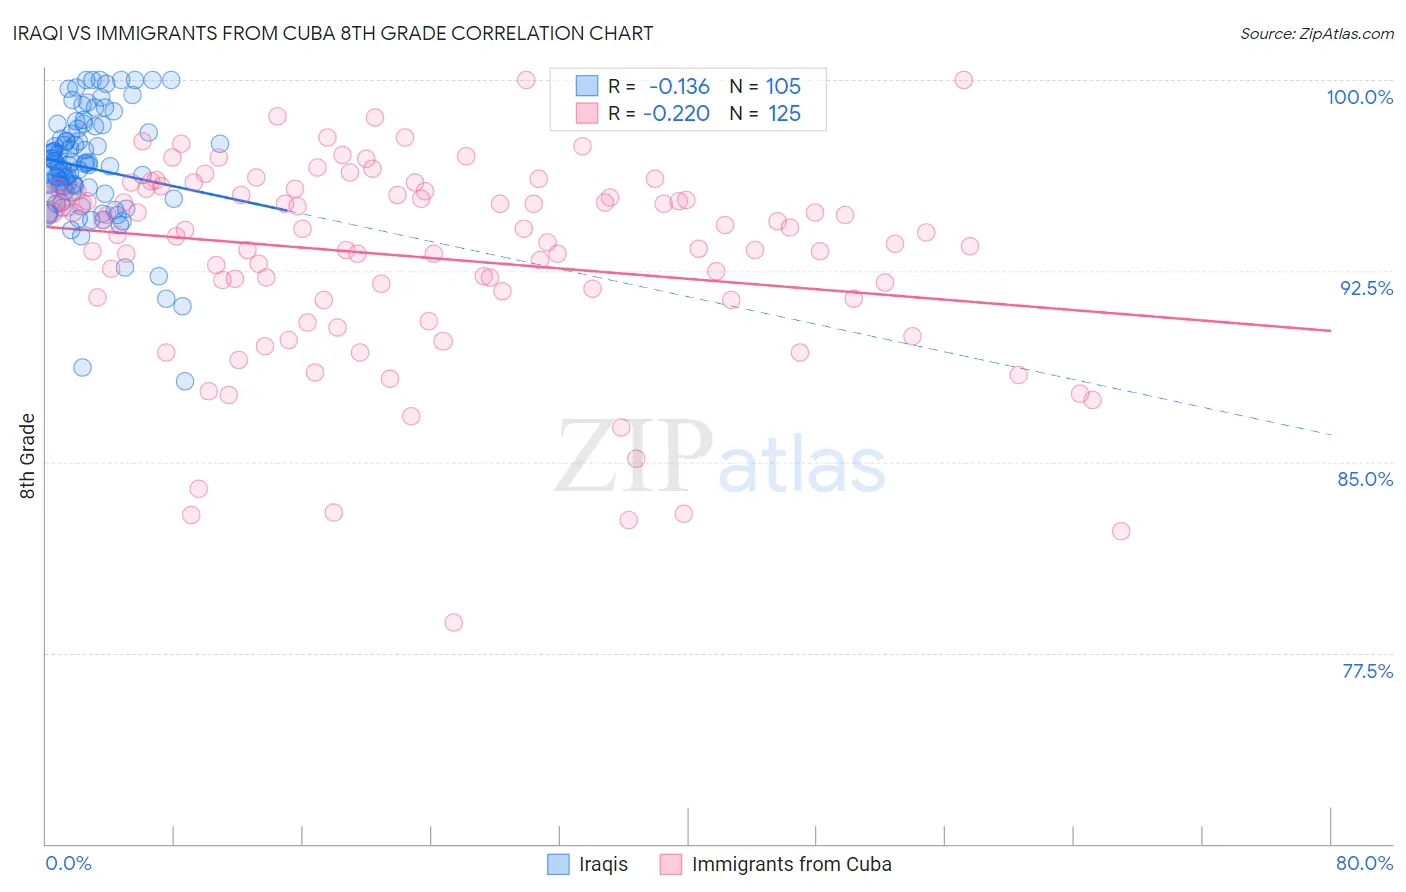
Iraqi vs Immigrants from Cuba 8th Grade Correlation Chart

The statistical analysis conducted on geographies consisting of 170,614,457 people shows a poor negative correlation between the proportion of Iraqis and percentage of population with at least 8th grade education in the United States with a correlation coefficient (R) of -0.136 and weighted average of 95.7%. Similarly, the statistical analysis conducted on geographies consisting of 326,028,159 people shows a weak negative correlation between the proportion of Immigrants from Cuba and percentage of population with at least 8th grade education in the United States with a correlation coefficient (R) of -0.220 and weighted average of 93.2%, a difference of 2.6%.
Iraqi vs Immigrants from Cuba 8th Grade

8th Grade Correlation Summary

MeasurementIraqiImmigrants from Cuba
Minimum88.2%78.7%
Maximum100.0%100.0%
Range11.8%21.3%
Mean96.6%93.0%
Median96.7%94.1%
Interquartile 25% (IQ1)95.6%91.4%
Interquartile 75% (IQ3)97.9%95.6%
Interquartile Range (IQR)2.3%4.2%
Standard Deviation (Sample)2.2%3.9%
Standard Deviation (Population)2.2%3.9%

Similar Demographics by 8th Grade

Demographics Similar to Iraqis by 8th Grade

In terms of 8th grade, the demographic groups most similar to Iraqis are Immigrants from Spain (95.7%, a difference of 0.010%), Immigrants from Egypt (95.7%, a difference of 0.020%), Immigrants from Brazil (95.7%, a difference of 0.030%), Immigrants from Iraq (95.6%, a difference of 0.030%), and Immigrants from Uganda (95.6%, a difference of 0.030%).
DemographicsRating | Rank8th Grade
Mongolians
53.0
/100
|
#173
Average
95.8%
Chileans
50.0
/100
|
#174
Average
95.7%
Immigrants | Albania
49.6
/100
|
#175
Average
95.7%
Pakistanis
48.8
/100
|
#176
Average
95.7%
Marshallese
47.6
/100
|
#177
Average
95.7%
Venezuelans
47.5
/100
|
#178
Average
95.7%
Immigrants | Brazil
45.4
/100
|
#179
Average
95.7%
Iraqis
40.5
/100
|
#180
Average
95.7%
Immigrants | Spain
38.7
/100
|
#181
Fair
95.7%
Immigrants | Egypt
37.9
/100
|
#182
Fair
95.7%
Immigrants | Iraq
36.2
/100
|
#183
Fair
95.6%
Immigrants | Uganda
36.0
/100
|
#184
Fair
95.6%
Blacks/African Americans
34.8
/100
|
#185
Fair
95.6%
Brazilians
34.8
/100
|
#186
Fair
95.6%
Sudanese
33.0
/100
|
#187
Fair
95.6%

Demographics Similar to Immigrants from Cuba by 8th Grade

In terms of 8th grade, the demographic groups most similar to Immigrants from Cuba are Puerto Rican (93.2%, a difference of 0.030%), Immigrants from Fiji (93.2%, a difference of 0.030%), Immigrants from Ecuador (93.3%, a difference of 0.040%), Immigrants from Cambodia (93.3%, a difference of 0.10%), and Belizean (93.1%, a difference of 0.16%).
DemographicsRating | Rank8th Grade
Cape Verdeans
0.0
/100
|
#312
Tragic
93.5%
Immigrants | Caribbean
0.0
/100
|
#313
Tragic
93.5%
Immigrants | Vietnam
0.0
/100
|
#314
Tragic
93.5%
Vietnamese
0.0
/100
|
#315
Tragic
93.5%
Immigrants | Cambodia
0.0
/100
|
#316
Tragic
93.3%
Immigrants | Ecuador
0.0
/100
|
#317
Tragic
93.3%
Puerto Ricans
0.0
/100
|
#318
Tragic
93.2%
Immigrants | Cuba
0.0
/100
|
#319
Tragic
93.2%
Immigrants | Fiji
0.0
/100
|
#320
Tragic
93.2%
Belizeans
0.0
/100
|
#321
Tragic
93.1%
Nicaraguans
0.0
/100
|
#322
Tragic
93.0%
Immigrants | Belize
0.0
/100
|
#323
Tragic
92.9%
Nepalese
0.0
/100
|
#324
Tragic
92.8%
Dominicans
0.0
/100
|
#325
Tragic
92.8%
Central American Indians
0.0
/100
|
#326
Tragic
92.7%