Indonesian vs Liberian 9th Grade
COMPARE
Indonesian
Liberian
9th Grade
9th Grade Comparison
Indonesians
Liberians
93.1%
9TH GRADE
0.0/ 100
METRIC RATING
296th/ 347
METRIC RANK
94.8%
9TH GRADE
37.4/ 100
METRIC RATING
185th/ 347
METRIC RANK
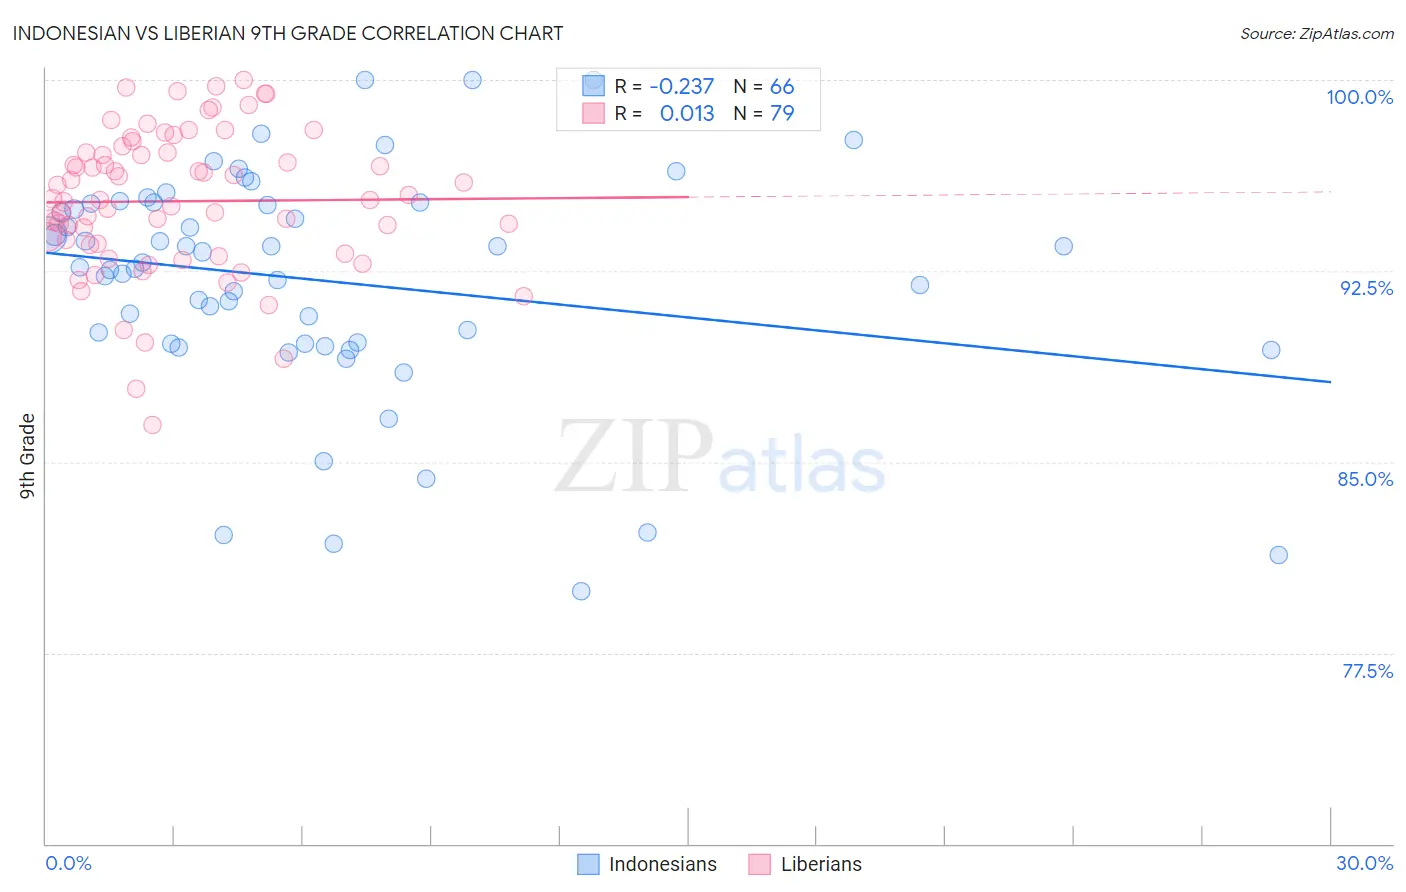
Indonesian vs Liberian 9th Grade Correlation Chart
The statistical analysis conducted on geographies consisting of 162,727,113 people shows a weak negative correlation between the proportion of Indonesians and percentage of population with at least 9th grade education in the United States with a correlation coefficient (R) of -0.237 and weighted average of 93.1%. Similarly, the statistical analysis conducted on geographies consisting of 118,101,800 people shows no correlation between the proportion of Liberians and percentage of population with at least 9th grade education in the United States with a correlation coefficient (R) of 0.013 and weighted average of 94.8%, a difference of 1.8%.
9th Grade Correlation Summary
| Measurement | Indonesian | Liberian |
| Minimum | 79.9% | 86.4% |
| Maximum | 100.0% | 100.0% |
| Range | 20.1% | 13.6% |
| Mean | 92.1% | 95.2% |
| Median | 92.7% | 95.3% |
| Interquartile 25% (IQ1) | 89.6% | 93.5% |
| Interquartile 75% (IQ3) | 95.1% | 97.2% |
| Interquartile Range (IQR) | 5.5% | 3.7% |
| Standard Deviation (Sample) | 4.5% | 2.8% |
| Standard Deviation (Population) | 4.4% | 2.8% |
Similar Demographics by 9th Grade
Demographics Similar to Indonesians by 9th Grade
In terms of 9th grade, the demographic groups most similar to Indonesians are Immigrants from Burma/Myanmar (93.1%, a difference of 0.0%), Cuban (93.2%, a difference of 0.020%), Sri Lankan (93.2%, a difference of 0.030%), Fijian (93.1%, a difference of 0.030%), and Immigrants from Laos (93.2%, a difference of 0.040%).
| Demographics | Rating | Rank | 9th Grade |
| Immigrants | West Indies | 0.0 /100 | #289 | Tragic 93.3% |
| Pennsylvania Germans | 0.0 /100 | #290 | Tragic 93.3% |
| British West Indians | 0.0 /100 | #291 | Tragic 93.2% |
| Immigrants | Laos | 0.0 /100 | #292 | Tragic 93.2% |
| Sri Lankans | 0.0 /100 | #293 | Tragic 93.2% |
| Cubans | 0.0 /100 | #294 | Tragic 93.2% |
| Immigrants | Burma/Myanmar | 0.0 /100 | #295 | Tragic 93.1% |
| Indonesians | 0.0 /100 | #296 | Tragic 93.1% |
| Fijians | 0.0 /100 | #297 | Tragic 93.1% |
| Haitians | 0.0 /100 | #298 | Tragic 93.1% |
| Immigrants | Grenada | 0.0 /100 | #299 | Tragic 93.0% |
| Yaqui | 0.0 /100 | #300 | Tragic 92.9% |
| Immigrants | Haiti | 0.0 /100 | #301 | Tragic 92.7% |
| Immigrants | Dominica | 0.0 /100 | #302 | Tragic 92.7% |
| Guyanese | 0.0 /100 | #303 | Tragic 92.7% |
Demographics Similar to Liberians by 9th Grade
In terms of 9th grade, the demographic groups most similar to Liberians are Argentinean (94.8%, a difference of 0.0%), Hopi (94.8%, a difference of 0.0%), Immigrants from Nepal (94.8%, a difference of 0.020%), Guamanian/Chamorro (94.8%, a difference of 0.020%), and Immigrants from Albania (94.8%, a difference of 0.020%).
| Demographics | Rating | Rank | 9th Grade |
| Immigrants | Poland | 46.7 /100 | #178 | Average 94.9% |
| Immigrants | Venezuela | 46.5 /100 | #179 | Average 94.9% |
| Immigrants | Uganda | 43.1 /100 | #180 | Average 94.8% |
| Sierra Leoneans | 42.7 /100 | #181 | Average 94.8% |
| Seminole | 42.5 /100 | #182 | Average 94.8% |
| Immigrants | Nepal | 39.7 /100 | #183 | Fair 94.8% |
| Argentineans | 37.6 /100 | #184 | Fair 94.8% |
| Liberians | 37.4 /100 | #185 | Fair 94.8% |
| Hopi | 37.1 /100 | #186 | Fair 94.8% |
| Guamanians/Chamorros | 35.5 /100 | #187 | Fair 94.8% |
| Immigrants | Albania | 34.5 /100 | #188 | Fair 94.8% |
| Immigrants | Argentina | 34.4 /100 | #189 | Fair 94.8% |
| Sudanese | 32.7 /100 | #190 | Fair 94.7% |
| Assyrians/Chaldeans/Syriacs | 32.0 /100 | #191 | Fair 94.7% |
| Immigrants | Northern Africa | 30.7 /100 | #192 | Fair 94.7% |