Indonesian vs Immigrants from Spain 3rd Grade
COMPARE
Indonesian
Immigrants from Spain
3rd Grade
3rd Grade Comparison
Indonesians
Immigrants from Spain
96.5%
3RD GRADE
0.0/ 100
METRIC RATING
321st/ 347
METRIC RANK
97.8%
3RD GRADE
54.3/ 100
METRIC RATING
168th/ 347
METRIC RANK
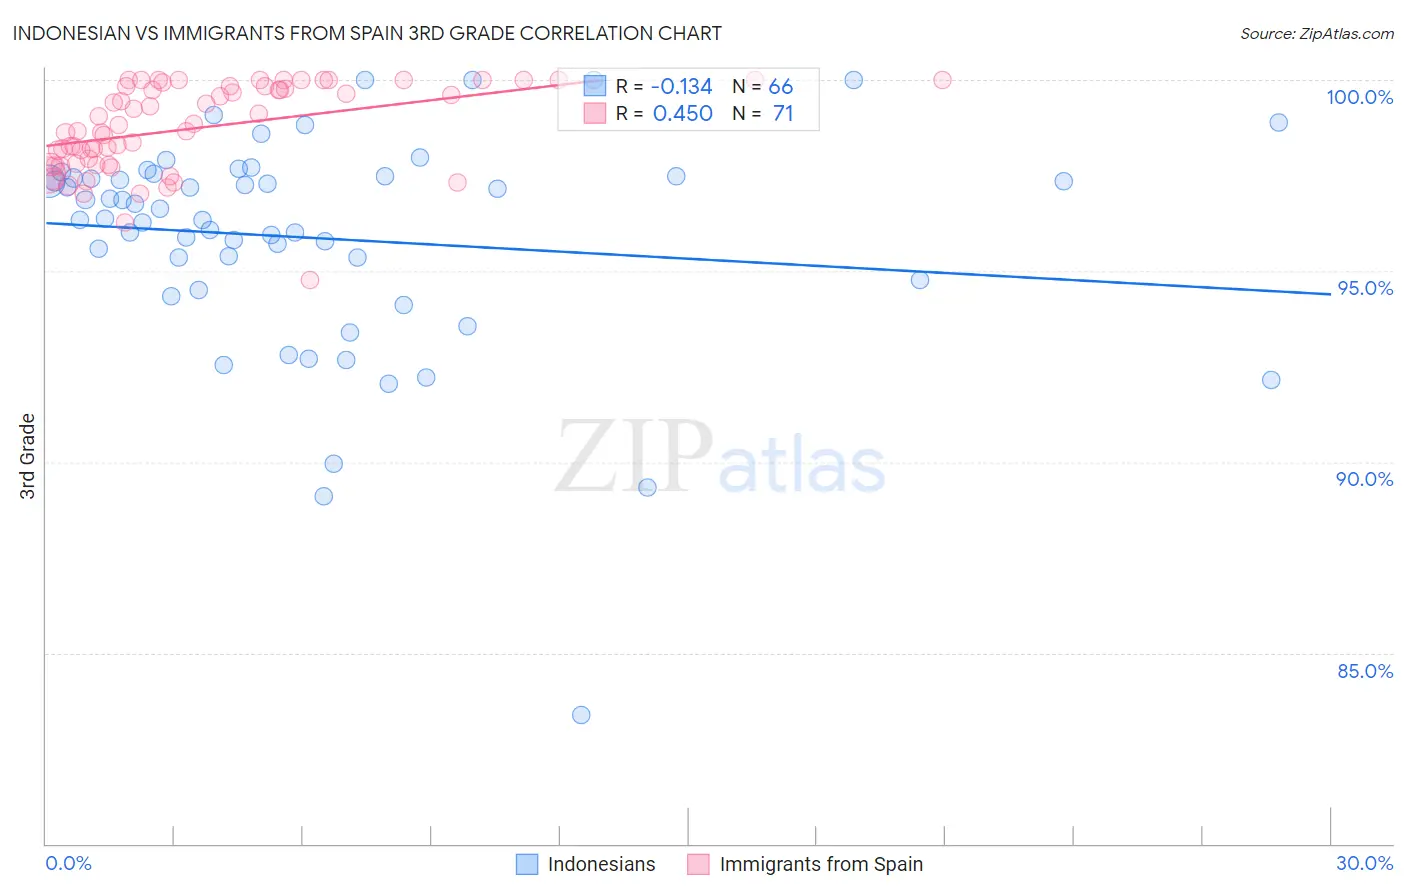
Indonesian vs Immigrants from Spain 3rd Grade Correlation Chart
The statistical analysis conducted on geographies consisting of 162,727,113 people shows a poor negative correlation between the proportion of Indonesians and percentage of population with at least 3rd grade education in the United States with a correlation coefficient (R) of -0.134 and weighted average of 96.5%. Similarly, the statistical analysis conducted on geographies consisting of 239,682,160 people shows a moderate positive correlation between the proportion of Immigrants from Spain and percentage of population with at least 3rd grade education in the United States with a correlation coefficient (R) of 0.450 and weighted average of 97.8%, a difference of 1.3%.
3rd Grade Correlation Summary
| Measurement | Indonesian | Immigrants from Spain |
| Minimum | 83.4% | 94.8% |
| Maximum | 100.0% | 100.0% |
| Range | 16.6% | 5.2% |
| Mean | 95.9% | 98.8% |
| Median | 96.5% | 98.8% |
| Interquartile 25% (IQ1) | 94.8% | 97.8% |
| Interquartile 75% (IQ3) | 97.5% | 99.8% |
| Interquartile Range (IQR) | 2.7% | 2.1% |
| Standard Deviation (Sample) | 2.9% | 1.1% |
| Standard Deviation (Population) | 2.9% | 1.1% |
Similar Demographics by 3rd Grade
Demographics Similar to Indonesians by 3rd Grade
In terms of 3rd grade, the demographic groups most similar to Indonesians are Immigrants from Nicaragua (96.5%, a difference of 0.0%), Immigrants from Belize (96.5%, a difference of 0.0%), Vietnamese (96.5%, a difference of 0.010%), Honduran (96.5%, a difference of 0.020%), and Hispanic or Latino (96.5%, a difference of 0.030%).
| Demographics | Rating | Rank | 3rd Grade |
| Belizeans | 0.0 /100 | #314 | Tragic 96.6% |
| Immigrants | Azores | 0.0 /100 | #315 | Tragic 96.6% |
| Immigrants | Burma/Myanmar | 0.0 /100 | #316 | Tragic 96.6% |
| Immigrants | Bangladesh | 0.0 /100 | #317 | Tragic 96.6% |
| Hispanics or Latinos | 0.0 /100 | #318 | Tragic 96.5% |
| Vietnamese | 0.0 /100 | #319 | Tragic 96.5% |
| Immigrants | Nicaragua | 0.0 /100 | #320 | Tragic 96.5% |
| Indonesians | 0.0 /100 | #321 | Tragic 96.5% |
| Immigrants | Belize | 0.0 /100 | #322 | Tragic 96.5% |
| Hondurans | 0.0 /100 | #323 | Tragic 96.5% |
| Dominicans | 0.0 /100 | #324 | Tragic 96.4% |
| Mexican American Indians | 0.0 /100 | #325 | Tragic 96.4% |
| Immigrants | Vietnam | 0.0 /100 | #326 | Tragic 96.4% |
| Japanese | 0.0 /100 | #327 | Tragic 96.4% |
| Bangladeshis | 0.0 /100 | #328 | Tragic 96.3% |
Demographics Similar to Immigrants from Spain by 3rd Grade
In terms of 3rd grade, the demographic groups most similar to Immigrants from Spain are Dutch West Indian (97.8%, a difference of 0.0%), Chilean (97.8%, a difference of 0.0%), Comanche (97.8%, a difference of 0.0%), Brazilian (97.8%, a difference of 0.0%), and Immigrants from Jordan (97.8%, a difference of 0.010%).
| Demographics | Rating | Rank | 3rd Grade |
| Albanians | 58.8 /100 | #161 | Average 97.8% |
| Immigrants | Jordan | 57.9 /100 | #162 | Average 97.8% |
| Marshallese | 57.2 /100 | #163 | Average 97.8% |
| Immigrants | Bosnia and Herzegovina | 56.2 /100 | #164 | Average 97.8% |
| Ugandans | 56.1 /100 | #165 | Average 97.8% |
| Dutch West Indians | 55.5 /100 | #166 | Average 97.8% |
| Chileans | 55.3 /100 | #167 | Average 97.8% |
| Immigrants | Spain | 54.3 /100 | #168 | Average 97.8% |
| Comanche | 53.8 /100 | #169 | Average 97.8% |
| Brazilians | 53.7 /100 | #170 | Average 97.8% |
| Kenyans | 51.8 /100 | #171 | Average 97.8% |
| Spanish Americans | 51.8 /100 | #172 | Average 97.8% |
| Immigrants | Korea | 50.9 /100 | #173 | Average 97.8% |
| Navajo | 50.0 /100 | #174 | Average 97.8% |
| Immigrants | Micronesia | 47.6 /100 | #175 | Average 97.8% |