Immigrants from Yemen vs Immigrants from Switzerland 2nd Grade

COMPARE

Immigrants from Yemen
Race
Ancestry
AfghanAfricanAlaska NativeAlaskan AthabascanAlbanianAleutAlsatianAmericanApacheArabArapahoArgentineanArmenianAssyrian/Chaldean/SyriacAustralianAustrianBahamianBangladeshiBarbadianBasqueBelgianBelizeanBermudanBhutaneseBlackfeetBolivianBrazilianBritishBritish West IndianBulgarianBurmeseCajunCambodianCanadianCape VerdeanCarpatho RusynCelticCentral AmericanCentral American IndianCherokeeCheyenneChickasawChileanChineseChippewaChoctawColombianColvilleComancheCosta RicanCreeCreekCroatianCrowCubanCypriotCzechCzechoslovakianDanishDelawareDominicanDutchDutch West IndianEastern EuropeanEcuadorianEgyptianEnglishEstonianEthiopianEuropeanFijianFilipinoFinnishFrenchFrench American IndianFrench CanadianGermanGerman RussianGhanaianGreekGuamanian/ChamorroGuatemalanGuyaneseHaitianHmongHonduranHopiHoumaHungarianIcelanderIndian (Asian)IndonesianInupiatIranianIraqiIrishIroquoisIsraeliItalianJamaicanJapaneseJordanianKenyanKiowaKoreanLaotianLatvianLebaneseLiberianLithuanianLumbeeLuxembourgerMacedonianMalaysianMalteseMarshalleseMenomineeMexicanMexican American IndianMongolianMoroccanNative HawaiianNavajoNepaleseNew ZealanderNicaraguanNigerianNorthern EuropeanNorwegianOkinawanOsageOttawaPaiutePakistaniPalestinianPanamanianParaguayanPennsylvania GermanPeruvianPimaPolishPortuguesePotawatomiPuebloPuerto RicanPuget Sound SalishRomanianRussianSalvadoranSamoanScandinavianScotch-IrishScottishSeminoleSenegaleseSerbianShoshoneSierra LeoneanSiouxSlavicSlovakSloveneSomaliSouth AfricanSouth AmericanSouth American IndianSoviet UnionSpaniardSpanishSpanish AmericanSpanish American IndianSri LankanSubsaharan AfricanSudaneseSwedishSwissSyrianTaiwaneseThaiTlingit-HaidaTohono O'OdhamTonganTrinidadian and TobagonianTsimshianTurkishU.S. Virgin IslanderUgandanUkrainianUruguayanUteVenezuelanVietnameseWelshWest IndianYakamaYaquiYugoslavianYumanYup'ikZimbabwean
Immigration
NonimmigrantsImmigrantsAfghanistanAfricaAlbaniaArgentinaArmeniaAsiaAustraliaAustriaBahamasBangladeshBarbadosBelarusBelgiumBelizeBoliviaBosnia and HerzegovinaBrazilBulgariaBurma/MyanmarCabo VerdeCambodiaCameroonCanadaCaribbeanCentral AmericaChileChinaColombiaCongoCosta RicaCroatiaCubaCzechoslovakiaDenmarkDominicaDominican RepublicEastern AfricaEastern AsiaEastern EuropeEcuadorEgyptEl SalvadorEnglandEritreaEthiopiaEuropeFijiFranceGermanyGhanaGreeceGrenadaGuatemalaGuyanaHaitiHondurasHong KongHungaryIndiaIndonesiaIranIraqIrelandIsraelItalyJamaicaJapanJordanKazakhstanKenyaKoreaKuwaitLaosLatin AmericaLatviaLebanonLiberiaLithuaniaMalaysiaMexicoMicronesiaMiddle AfricaMoldovaMoroccoNepalNetherlandsNicaraguaNigeriaNorth AmericaNorth MacedoniaNorthern AfricaNorthern EuropeNorwayOceaniaPakistanPanamaPeruPhilippinesPolandPortugalRomaniaRussiaSaudi ArabiaScotlandSenegalSerbiaSierra LeoneSingaporeSomaliaSouth AfricaSouth AmericaSouth Central AsiaSouth Eastern AsiaSouthern EuropeSpainSri LankaSt. Vincent and the GrenadinesSudanSwedenSyriaTaiwanThailandTrinidad and TobagoTurkeyUgandaUkraineUruguayUzbekistanVenezuelaVietnamWest IndiesWestern AfricaWestern AsiaWestern EuropeYemenZaireZimbabweAzores
Immigrants from Switzerland
Race
Ancestry
AfghanAfricanAlaska NativeAlaskan AthabascanAlbanianAleutAlsatianAmericanApacheArabArapahoArgentineanArmenianAssyrian/Chaldean/SyriacAustralianAustrianBahamianBangladeshiBarbadianBasqueBelgianBelizeanBermudanBhutaneseBlackfeetBolivianBrazilianBritishBritish West IndianBulgarianBurmeseCajunCambodianCanadianCape VerdeanCarpatho RusynCelticCentral AmericanCentral American IndianCherokeeCheyenneChickasawChileanChineseChippewaChoctawColombianColvilleComancheCosta RicanCreeCreekCroatianCrowCubanCypriotCzechCzechoslovakianDanishDelawareDominicanDutchDutch West IndianEastern EuropeanEcuadorianEgyptianEnglishEstonianEthiopianEuropeanFijianFilipinoFinnishFrenchFrench American IndianFrench CanadianGermanGerman RussianGhanaianGreekGuamanian/ChamorroGuatemalanGuyaneseHaitianHmongHonduranHopiHoumaHungarianIcelanderIndian (Asian)IndonesianInupiatIranianIraqiIrishIroquoisIsraeliItalianJamaicanJapaneseJordanianKenyanKiowaKoreanLaotianLatvianLebaneseLiberianLithuanianLumbeeLuxembourgerMacedonianMalaysianMalteseMarshalleseMenomineeMexicanMexican American IndianMongolianMoroccanNative HawaiianNavajoNepaleseNew ZealanderNicaraguanNigerianNorthern EuropeanNorwegianOkinawanOsageOttawaPaiutePakistaniPalestinianPanamanianParaguayanPennsylvania GermanPeruvianPimaPolishPortuguesePotawatomiPuebloPuerto RicanPuget Sound SalishRomanianRussianSalvadoranSamoanScandinavianScotch-IrishScottishSeminoleSenegaleseSerbianShoshoneSierra LeoneanSiouxSlavicSlovakSloveneSomaliSouth AfricanSouth AmericanSouth American IndianSoviet UnionSpaniardSpanishSpanish AmericanSpanish American IndianSri LankanSubsaharan AfricanSudaneseSwedishSwissSyrianTaiwaneseThaiTlingit-HaidaTohono O'OdhamTonganTrinidadian and TobagonianTsimshianTurkishU.S. Virgin IslanderUgandanUkrainianUruguayanUteVenezuelanVietnameseWelshWest IndianYakamaYaquiYugoslavianYumanYup'ikZimbabwean
Immigration
NonimmigrantsImmigrantsAfghanistanAfricaAlbaniaArgentinaArmeniaAsiaAustraliaAustriaBahamasBangladeshBarbadosBelarusBelgiumBelizeBoliviaBosnia and HerzegovinaBrazilBulgariaBurma/MyanmarCabo VerdeCambodiaCameroonCanadaCaribbeanCentral AmericaChileChinaColombiaCongoCosta RicaCroatiaCubaCzechoslovakiaDenmarkDominicaDominican RepublicEastern AfricaEastern AsiaEastern EuropeEcuadorEgyptEl SalvadorEnglandEritreaEthiopiaEuropeFijiFranceGermanyGhanaGreeceGrenadaGuatemalaGuyanaHaitiHondurasHong KongHungaryIndiaIndonesiaIranIraqIrelandIsraelItalyJamaicaJapanJordanKazakhstanKenyaKoreaKuwaitLaosLatin AmericaLatviaLebanonLiberiaLithuaniaMalaysiaMexicoMicronesiaMiddle AfricaMoldovaMoroccoNepalNetherlandsNicaraguaNigeriaNorth AmericaNorth MacedoniaNorthern AfricaNorthern EuropeNorwayOceaniaPakistanPanamaPeruPhilippinesPolandPortugalRomaniaRussiaSaudi ArabiaScotlandSenegalSerbiaSierra LeoneSingaporeSomaliaSouth AfricaSouth AmericaSouth Central AsiaSouth Eastern AsiaSouthern EuropeSpainSri LankaSt. Vincent and the GrenadinesSudanSwedenSwitzerlandSyriaTaiwanThailandTrinidad and TobagoTurkeyUgandaUkraineUruguayUzbekistanVenezuelaVietnamWest IndiesWestern AfricaWestern AsiaWestern EuropeZaireZimbabweAzores
2nd Grade
Income
Poverty
Unemployment
Labor Participation
Family Structure
Vehicle Availability
Education Level
Disability

2nd Grade Comparison

Immigrants from Yemen

Immigrants from Switzerland

Tragic
Exceptional
95.7%
2ND GRADE
0.0/ 100
METRIC RATING
346th/ 347
METRIC RANK
98.1%
2ND GRADE
97.3/ 100
METRIC RATING
108th/ 347
METRIC RANK

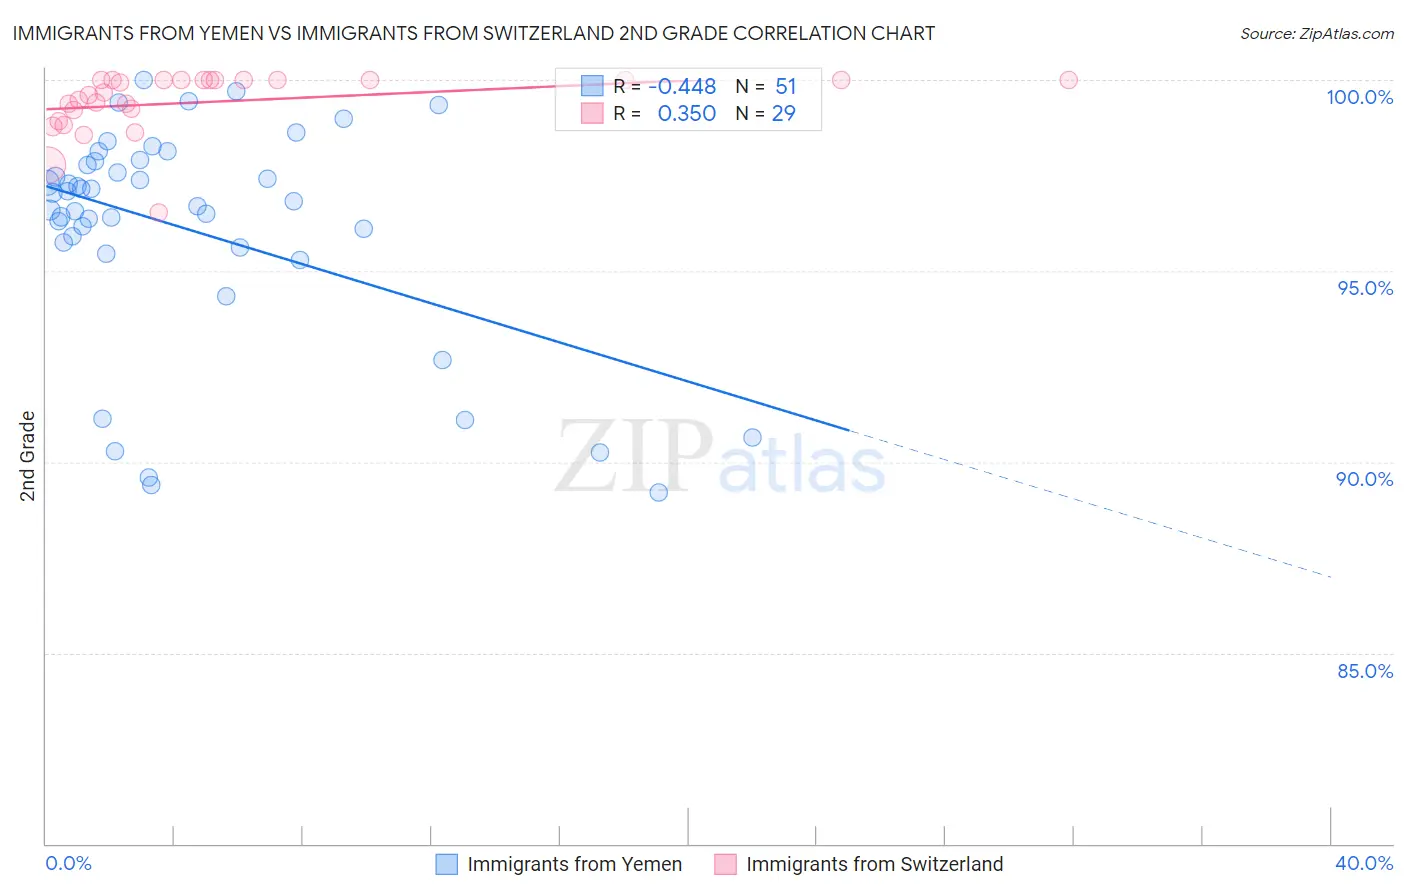
Immigrants from Yemen vs Immigrants from Switzerland 2nd Grade Correlation Chart

The statistical analysis conducted on geographies consisting of 82,433,611 people shows a moderate negative correlation between the proportion of Immigrants from Yemen and percentage of population with at least 2nd grade education in the United States with a correlation coefficient (R) of -0.448 and weighted average of 95.7%. Similarly, the statistical analysis conducted on geographies consisting of 148,082,451 people shows a mild positive correlation between the proportion of Immigrants from Switzerland and percentage of population with at least 2nd grade education in the United States with a correlation coefficient (R) of 0.350 and weighted average of 98.1%, a difference of 2.5%.
Immigrants from Yemen vs Immigrants from Switzerland 2nd Grade

2nd Grade Correlation Summary

MeasurementImmigrants from YemenImmigrants from Switzerland
Minimum89.2%96.5%
Maximum100.0%100.0%
Range10.8%3.5%
Mean96.1%99.4%
Median96.8%99.7%
Interquartile 25% (IQ1)95.6%99.1%
Interquartile 75% (IQ3)97.9%100.0%
Interquartile Range (IQR)2.3%0.93%
Standard Deviation (Sample)2.9%0.80%
Standard Deviation (Population)2.9%0.79%

Similar Demographics by 2nd Grade

Demographics Similar to Immigrants from Yemen by 2nd Grade

In terms of 2nd grade, the demographic groups most similar to Immigrants from Yemen are Immigrants from El Salvador (95.9%, a difference of 0.14%), Spanish American Indian (95.6%, a difference of 0.18%), Salvadoran (96.0%, a difference of 0.31%), Nepalese (96.1%, a difference of 0.34%), and Immigrants from Mexico (96.1%, a difference of 0.43%).
DemographicsRating | Rank2nd Grade
Immigrants | Dominican Republic
0.0
/100
|
#333
Tragic
96.4%
Central Americans
0.0
/100
|
#334
Tragic
96.4%
Yakama
0.0
/100
|
#335
Tragic
96.4%
Immigrants | Fiji
0.0
/100
|
#336
Tragic
96.4%
Immigrants | Cambodia
0.0
/100
|
#337
Tragic
96.4%
Immigrants | Cabo Verde
0.0
/100
|
#338
Tragic
96.3%
Guatemalans
0.0
/100
|
#339
Tragic
96.3%
Immigrants | Guatemala
0.0
/100
|
#340
Tragic
96.2%
Immigrants | Central America
0.0
/100
|
#341
Tragic
96.2%
Immigrants | Mexico
0.0
/100
|
#342
Tragic
96.1%
Nepalese
0.0
/100
|
#343
Tragic
96.1%
Salvadorans
0.0
/100
|
#344
Tragic
96.0%
Immigrants | El Salvador
0.0
/100
|
#345
Tragic
95.9%
Immigrants | Yemen
0.0
/100
|
#346
Tragic
95.7%
Spanish American Indians
0.0
/100
|
#347
Tragic
95.6%

Demographics Similar to Immigrants from Switzerland by 2nd Grade

In terms of 2nd grade, the demographic groups most similar to Immigrants from Switzerland are Bhutanese (98.1%, a difference of 0.0%), German Russian (98.1%, a difference of 0.0%), Basque (98.1%, a difference of 0.0%), Pima (98.2%, a difference of 0.010%), and Turkish (98.2%, a difference of 0.010%).
DemographicsRating | Rank2nd Grade
Puget Sound Salish
98.0
/100
|
#101
Exceptional
98.2%
Cree
98.0
/100
|
#102
Exceptional
98.2%
Pima
97.6
/100
|
#103
Exceptional
98.2%
Turks
97.6
/100
|
#104
Exceptional
98.2%
Yugoslavians
97.5
/100
|
#105
Exceptional
98.2%
Bhutanese
97.5
/100
|
#106
Exceptional
98.1%
German Russians
97.4
/100
|
#107
Exceptional
98.1%
Immigrants | Switzerland
97.3
/100
|
#108
Exceptional
98.1%
Basques
97.2
/100
|
#109
Exceptional
98.1%
Immigrants | Singapore
97.0
/100
|
#110
Exceptional
98.1%
Immigrants | Czechoslovakia
96.9
/100
|
#111
Exceptional
98.1%
Colville
96.6
/100
|
#112
Exceptional
98.1%
Immigrants | Norway
96.5
/100
|
#113
Exceptional
98.1%
Immigrants | Latvia
96.4
/100
|
#114
Exceptional
98.1%
Iranians
95.9
/100
|
#115
Exceptional
98.1%