Immigrants from Yemen vs Immigrants from Morocco Doctorate Degree
COMPARE
Immigrants from Yemen
Immigrants from Morocco
Doctorate Degree
Doctorate Degree Comparison
Immigrants from Yemen
Immigrants from Morocco
1.4%
DOCTORATE DEGREE
0.2/ 100
METRIC RATING
293rd/ 347
METRIC RANK
2.0%
DOCTORATE DEGREE
95.5/ 100
METRIC RATING
120th/ 347
METRIC RANK
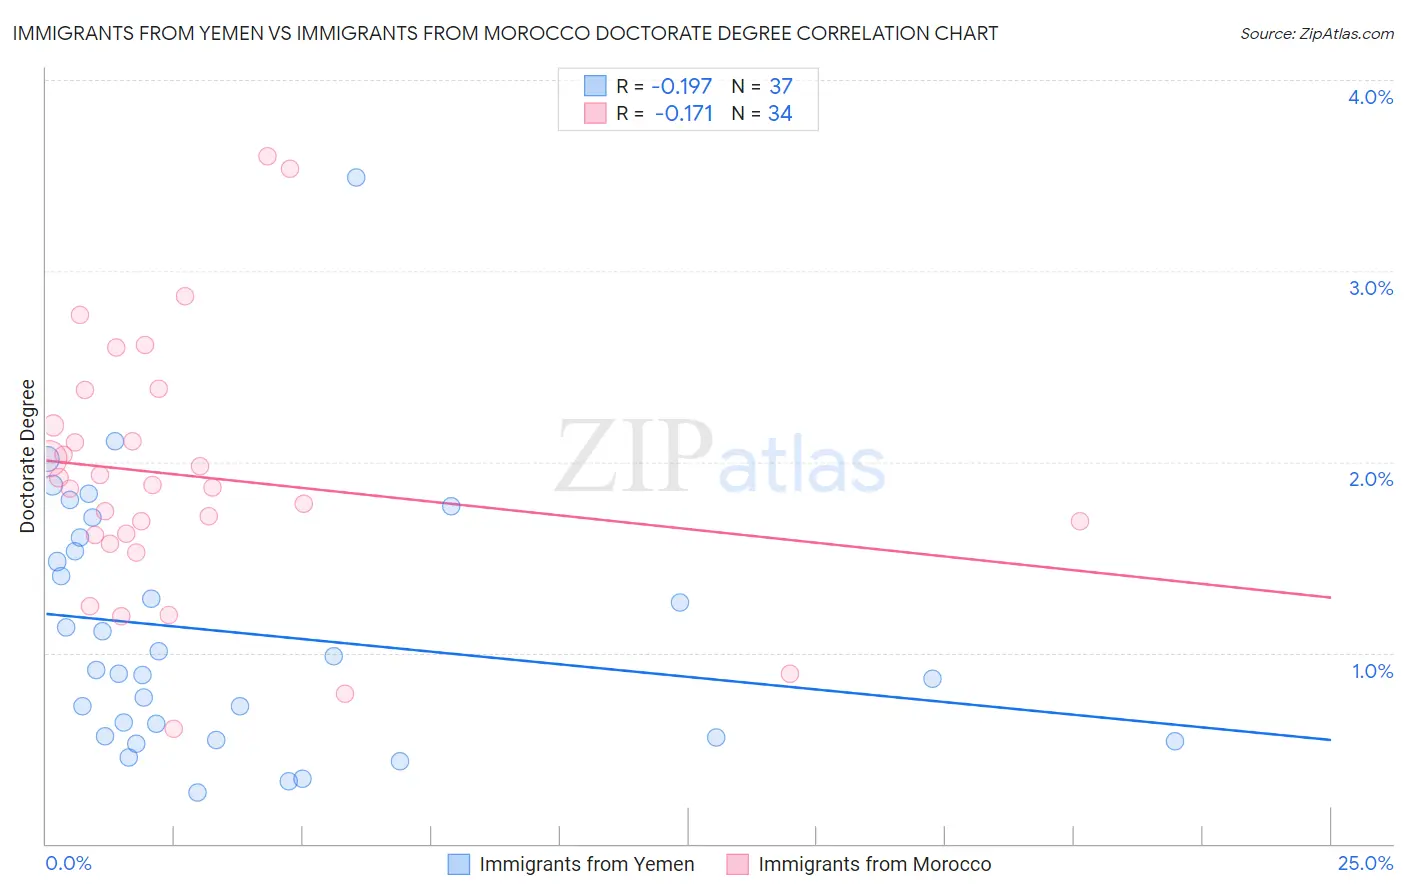
Immigrants from Yemen vs Immigrants from Morocco Doctorate Degree Correlation Chart
The statistical analysis conducted on geographies consisting of 82,189,372 people shows a poor negative correlation between the proportion of Immigrants from Yemen and percentage of population with at least doctorate degree education in the United States with a correlation coefficient (R) of -0.197 and weighted average of 1.4%. Similarly, the statistical analysis conducted on geographies consisting of 178,707,099 people shows a poor negative correlation between the proportion of Immigrants from Morocco and percentage of population with at least doctorate degree education in the United States with a correlation coefficient (R) of -0.171 and weighted average of 2.0%, a difference of 42.8%.
Doctorate Degree Correlation Summary
| Measurement | Immigrants from Yemen | Immigrants from Morocco |
| Minimum | 0.27% | 0.60% |
| Maximum | 3.5% | 3.6% |
| Range | 3.2% | 3.0% |
| Mean | 1.1% | 1.9% |
| Median | 0.91% | 1.9% |
| Interquartile 25% (IQ1) | 0.56% | 1.6% |
| Interquartile 75% (IQ3) | 1.6% | 2.2% |
| Interquartile Range (IQR) | 1.0% | 0.57% |
| Standard Deviation (Sample) | 0.67% | 0.67% |
| Standard Deviation (Population) | 0.66% | 0.66% |
Similar Demographics by Doctorate Degree
Demographics Similar to Immigrants from Yemen by Doctorate Degree
In terms of doctorate degree, the demographic groups most similar to Immigrants from Yemen are Alaska Native (1.4%, a difference of 0.59%), Samoan (1.4%, a difference of 0.71%), Black/African American (1.4%, a difference of 0.76%), Choctaw (1.4%, a difference of 0.99%), and Cape Verdean (1.4%, a difference of 1.0%).
| Demographics | Rating | Rank | Doctorate Degree |
| Cherokee | 0.3 /100 | #286 | Tragic 1.5% |
| Cajuns | 0.3 /100 | #287 | Tragic 1.5% |
| Immigrants | El Salvador | 0.3 /100 | #288 | Tragic 1.4% |
| Cape Verdeans | 0.3 /100 | #289 | Tragic 1.4% |
| Choctaw | 0.3 /100 | #290 | Tragic 1.4% |
| Blacks/African Americans | 0.3 /100 | #291 | Tragic 1.4% |
| Alaska Natives | 0.3 /100 | #292 | Tragic 1.4% |
| Immigrants | Yemen | 0.2 /100 | #293 | Tragic 1.4% |
| Samoans | 0.2 /100 | #294 | Tragic 1.4% |
| Guatemalans | 0.2 /100 | #295 | Tragic 1.4% |
| Immigrants | Ecuador | 0.2 /100 | #296 | Tragic 1.4% |
| Tsimshian | 0.2 /100 | #297 | Tragic 1.4% |
| Puerto Ricans | 0.1 /100 | #298 | Tragic 1.4% |
| Belizeans | 0.1 /100 | #299 | Tragic 1.4% |
| Immigrants | Guatemala | 0.1 /100 | #300 | Tragic 1.4% |
Demographics Similar to Immigrants from Morocco by Doctorate Degree
In terms of doctorate degree, the demographic groups most similar to Immigrants from Morocco are Pakistani (2.0%, a difference of 0.28%), Icelander (2.1%, a difference of 0.42%), Lebanese (2.1%, a difference of 0.45%), Immigrants from Jordan (2.0%, a difference of 0.48%), and Immigrants from Southern Europe (2.0%, a difference of 0.50%).
| Demographics | Rating | Rank | Doctorate Degree |
| Immigrants | Italy | 96.9 /100 | #113 | Exceptional 2.1% |
| Immigrants | Croatia | 96.8 /100 | #114 | Exceptional 2.1% |
| Taiwanese | 96.7 /100 | #115 | Exceptional 2.1% |
| Maltese | 96.2 /100 | #116 | Exceptional 2.1% |
| Lebanese | 96.0 /100 | #117 | Exceptional 2.1% |
| Icelanders | 96.0 /100 | #118 | Exceptional 2.1% |
| Pakistanis | 95.8 /100 | #119 | Exceptional 2.0% |
| Immigrants | Morocco | 95.5 /100 | #120 | Exceptional 2.0% |
| Immigrants | Jordan | 94.8 /100 | #121 | Exceptional 2.0% |
| Immigrants | Southern Europe | 94.7 /100 | #122 | Exceptional 2.0% |
| Croatians | 94.0 /100 | #123 | Exceptional 2.0% |
| Ute | 93.2 /100 | #124 | Exceptional 2.0% |
| Moroccans | 93.0 /100 | #125 | Exceptional 2.0% |
| Jordanians | 92.1 /100 | #126 | Exceptional 2.0% |
| Palestinians | 92.0 /100 | #127 | Exceptional 2.0% |