Immigrants from Western Europe vs Immigrants from Czechoslovakia 2nd Grade
COMPARE
Immigrants from Western Europe
Immigrants from Czechoslovakia
2nd Grade
2nd Grade Comparison
Immigrants from Western Europe
Immigrants from Czechoslovakia
98.2%
2ND GRADE
98.8/ 100
METRIC RATING
91st/ 347
METRIC RANK
98.1%
2ND GRADE
96.9/ 100
METRIC RATING
111th/ 347
METRIC RANK
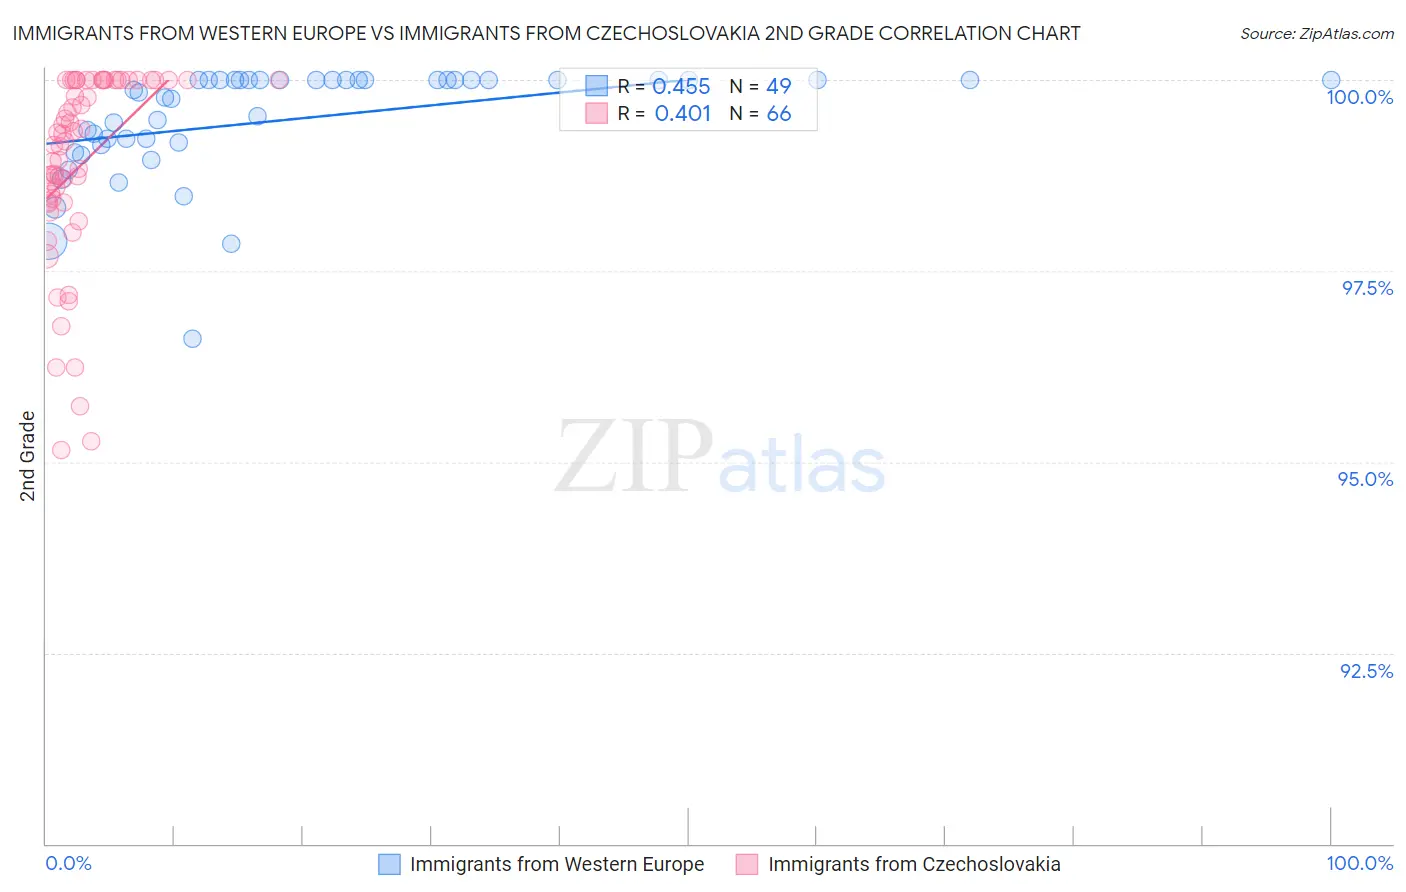
Immigrants from Western Europe vs Immigrants from Czechoslovakia 2nd Grade Correlation Chart
The statistical analysis conducted on geographies consisting of 494,080,297 people shows a moderate positive correlation between the proportion of Immigrants from Western Europe and percentage of population with at least 2nd grade education in the United States with a correlation coefficient (R) of 0.455 and weighted average of 98.2%. Similarly, the statistical analysis conducted on geographies consisting of 195,448,060 people shows a moderate positive correlation between the proportion of Immigrants from Czechoslovakia and percentage of population with at least 2nd grade education in the United States with a correlation coefficient (R) of 0.401 and weighted average of 98.1%, a difference of 0.080%.
2nd Grade Correlation Summary
| Measurement | Immigrants from Western Europe | Immigrants from Czechoslovakia |
| Minimum | 96.6% | 95.2% |
| Maximum | 100.0% | 100.0% |
| Range | 3.4% | 4.8% |
| Mean | 99.5% | 98.9% |
| Median | 99.9% | 99.2% |
| Interquartile 25% (IQ1) | 99.2% | 98.4% |
| Interquartile 75% (IQ3) | 100.0% | 100.0% |
| Interquartile Range (IQR) | 0.84% | 1.6% |
| Standard Deviation (Sample) | 0.73% | 1.2% |
| Standard Deviation (Population) | 0.72% | 1.2% |
Demographics Similar to Immigrants from Western Europe and Immigrants from Czechoslovakia by 2nd Grade
In terms of 2nd grade, the demographic groups most similar to Immigrants from Western Europe are Immigrants from South Africa (98.2%, a difference of 0.0%), Immigrants from India (98.2%, a difference of 0.0%), Immigrants from Germany (98.2%, a difference of 0.020%), South African (98.2%, a difference of 0.020%), and Cypriot (98.2%, a difference of 0.020%). Similarly, the demographic groups most similar to Immigrants from Czechoslovakia are Immigrants from Singapore (98.1%, a difference of 0.0%), German Russian (98.1%, a difference of 0.010%), Immigrants from Switzerland (98.1%, a difference of 0.010%), Basque (98.1%, a difference of 0.010%), and Pima (98.2%, a difference of 0.020%).
| Demographics | Rating | Rank | 2nd Grade |
| Immigrants | Western Europe | 98.8 /100 | #91 | Exceptional 98.2% |
| Immigrants | South Africa | 98.8 /100 | #92 | Exceptional 98.2% |
| Immigrants | India | 98.8 /100 | #93 | Exceptional 98.2% |
| Immigrants | Germany | 98.6 /100 | #94 | Exceptional 98.2% |
| South Africans | 98.6 /100 | #95 | Exceptional 98.2% |
| Cypriots | 98.4 /100 | #96 | Exceptional 98.2% |
| Choctaw | 98.3 /100 | #97 | Exceptional 98.2% |
| Immigrants | Nonimmigrants | 98.3 /100 | #98 | Exceptional 98.2% |
| Immigrants | Ireland | 98.0 /100 | #99 | Exceptional 98.2% |
| Romanians | 98.0 /100 | #100 | Exceptional 98.2% |
| Puget Sound Salish | 98.0 /100 | #101 | Exceptional 98.2% |
| Cree | 98.0 /100 | #102 | Exceptional 98.2% |
| Pima | 97.6 /100 | #103 | Exceptional 98.2% |
| Turks | 97.6 /100 | #104 | Exceptional 98.2% |
| Yugoslavians | 97.5 /100 | #105 | Exceptional 98.2% |
| Bhutanese | 97.5 /100 | #106 | Exceptional 98.1% |
| German Russians | 97.4 /100 | #107 | Exceptional 98.1% |
| Immigrants | Switzerland | 97.3 /100 | #108 | Exceptional 98.1% |
| Basques | 97.2 /100 | #109 | Exceptional 98.1% |
| Immigrants | Singapore | 97.0 /100 | #110 | Exceptional 98.1% |
| Immigrants | Czechoslovakia | 96.9 /100 | #111 | Exceptional 98.1% |