Immigrants from Western Europe vs Bermudan 4th Grade
COMPARE
Immigrants from Western Europe
Bermudan
4th Grade
4th Grade Comparison
Immigrants from Western Europe
Bermudans
97.9%
4TH GRADE
98.7/ 100
METRIC RATING
92nd/ 347
METRIC RANK
97.6%
4TH GRADE
60.5/ 100
METRIC RATING
162nd/ 347
METRIC RANK
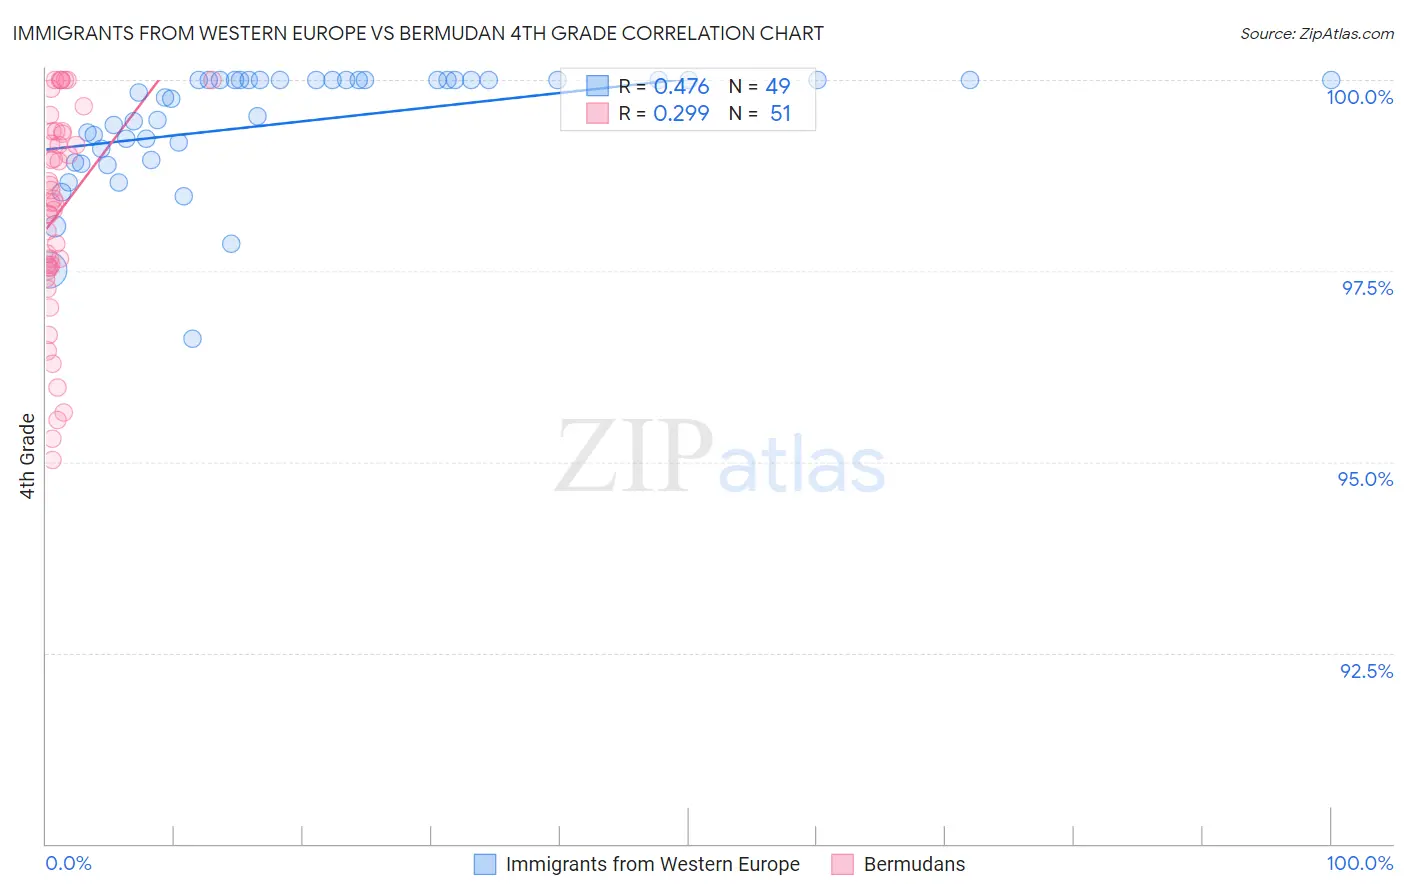
Immigrants from Western Europe vs Bermudan 4th Grade Correlation Chart
The statistical analysis conducted on geographies consisting of 494,080,297 people shows a moderate positive correlation between the proportion of Immigrants from Western Europe and percentage of population with at least 4th grade education in the United States with a correlation coefficient (R) of 0.476 and weighted average of 97.9%. Similarly, the statistical analysis conducted on geographies consisting of 55,721,975 people shows a weak positive correlation between the proportion of Bermudans and percentage of population with at least 4th grade education in the United States with a correlation coefficient (R) of 0.299 and weighted average of 97.6%, a difference of 0.37%.
4th Grade Correlation Summary
| Measurement | Immigrants from Western Europe | Bermudan |
| Minimum | 96.6% | 95.0% |
| Maximum | 100.0% | 100.0% |
| Range | 3.4% | 5.0% |
| Mean | 99.4% | 98.3% |
| Median | 99.8% | 98.4% |
| Interquartile 25% (IQ1) | 99.0% | 97.5% |
| Interquartile 75% (IQ3) | 100.0% | 99.3% |
| Interquartile Range (IQR) | 0.98% | 1.8% |
| Standard Deviation (Sample) | 0.77% | 1.4% |
| Standard Deviation (Population) | 0.76% | 1.3% |
Similar Demographics by 4th Grade
Demographics Similar to Immigrants from Western Europe by 4th Grade
In terms of 4th grade, the demographic groups most similar to Immigrants from Western Europe are Immigrants from South Africa (97.9%, a difference of 0.0%), Delaware (97.9%, a difference of 0.0%), Immigrants from Denmark (97.9%, a difference of 0.0%), Immigrants from Sweden (97.9%, a difference of 0.0%), and Immigrants from Ireland (97.9%, a difference of 0.0%).
| Demographics | Rating | Rank | 4th Grade |
| Potawatomi | 98.9 /100 | #85 | Exceptional 97.9% |
| Immigrants | Australia | 98.8 /100 | #86 | Exceptional 97.9% |
| Zimbabweans | 98.8 /100 | #87 | Exceptional 97.9% |
| Immigrants | South Africa | 98.8 /100 | #88 | Exceptional 97.9% |
| Delaware | 98.8 /100 | #89 | Exceptional 97.9% |
| Immigrants | Denmark | 98.7 /100 | #90 | Exceptional 97.9% |
| Immigrants | Sweden | 98.7 /100 | #91 | Exceptional 97.9% |
| Immigrants | Western Europe | 98.7 /100 | #92 | Exceptional 97.9% |
| Immigrants | Ireland | 98.7 /100 | #93 | Exceptional 97.9% |
| Shoshone | 98.7 /100 | #94 | Exceptional 97.9% |
| Immigrants | Germany | 98.5 /100 | #95 | Exceptional 97.9% |
| Romanians | 98.4 /100 | #96 | Exceptional 97.9% |
| Cheyenne | 98.4 /100 | #97 | Exceptional 97.9% |
| South Africans | 98.2 /100 | #98 | Exceptional 97.9% |
| Turks | 98.2 /100 | #99 | Exceptional 97.9% |
Demographics Similar to Bermudans by 4th Grade
In terms of 4th grade, the demographic groups most similar to Bermudans are Apache (97.6%, a difference of 0.0%), Marshallese (97.6%, a difference of 0.0%), Immigrants from Iran (97.6%, a difference of 0.0%), Immigrants from Italy (97.6%, a difference of 0.010%), and Ugandan (97.6%, a difference of 0.010%).
| Demographics | Rating | Rank | 4th Grade |
| Albanians | 67.0 /100 | #155 | Good 97.6% |
| Immigrants | Jordan | 66.9 /100 | #156 | Good 97.6% |
| Immigrants | Bosnia and Herzegovina | 66.0 /100 | #157 | Good 97.6% |
| French American Indians | 65.9 /100 | #158 | Good 97.6% |
| Immigrants | Italy | 63.7 /100 | #159 | Good 97.6% |
| Apache | 61.3 /100 | #160 | Good 97.6% |
| Marshallese | 60.8 /100 | #161 | Good 97.6% |
| Bermudans | 60.5 /100 | #162 | Good 97.6% |
| Immigrants | Iran | 60.3 /100 | #163 | Good 97.6% |
| Ugandans | 58.9 /100 | #164 | Average 97.6% |
| Venezuelans | 58.7 /100 | #165 | Average 97.6% |
| Kenyans | 56.5 /100 | #166 | Average 97.5% |
| Immigrants | Poland | 55.9 /100 | #167 | Average 97.5% |
| Immigrants | Belarus | 55.8 /100 | #168 | Average 97.5% |
| Chileans | 54.4 /100 | #169 | Average 97.5% |